

Properties and mortgage notes securing more than $300 million in outstanding CMBS debt were auctioned during Q2 2022, according to CRED iQ’s observations of impending losses for investors. The volume of CMBS auctions during Q2 2022 increased compared to Q1 2022 when 30 auctions tied to approximately $217 million in CMBS debt took place. Sales through an auction can take two to three months to close; however, sale transactions can be delayed or even fail to close after a due diligence process. Of the 30 auctions from the previous quarter, there were nine auctioned assets backing $68.3 million in CMBS debt that remained unresolved as of the June 2022 reporting period.
CRED iQ monitored 28 individual CMBS property and note sales through their respective auction processes during Q2 2022. A little more than half of those auctions, 15 in total, involved distressed sales facilitated by a special servicer. Of the 15 specially serviced assets, there were 10 REO properties with titles that transferred to respective CMBS trusts. Special servicers are tasked with liquidating these properties, sometimes after a period of stabilization, for maximum proceeds on behalf of CMBS certificate holders.
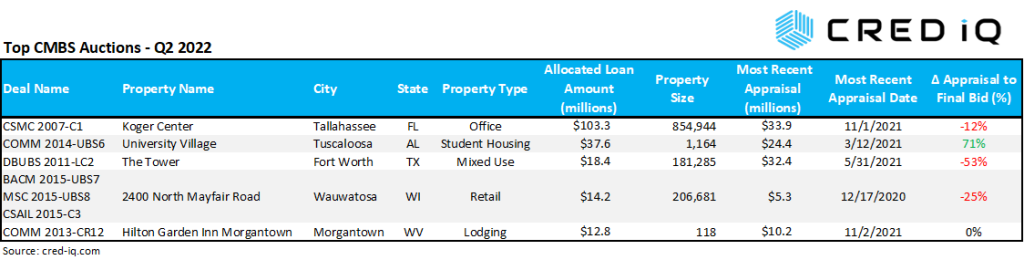
Of the 10 REO properties that were auctioned, the average holding period between title acquisition and auction date was approximately 2.1 years. The shortest holding period was three months, and the longest holding period was nearly six years. The quickest sale from REO title date to auction date was the 181,285-sf mixed-use (office/retail) property in Fort Worth, TX known as The Tower. The property transferred to special servicing in June 2021, shortly after a major tenant terminated its lease causing occupancy to fall to 48%. The special servicer acquired title on behalf of the CMBS trust in January 2022 and the property was auctioned three months later in April 2022. The property was reportedly sold for less than the asset’s $18.4 million outstanding debt amount. Additionally, net proceeds available to the CMBS trust will likely come in lower than the asset’s sale price to account for the repayment of servicer advances, interest on servicer advances, and other liquidation expenses.
By deal vintage, auctions over the past three months were most prevalent among 2014 and 2016 vintage securitizations. Comparing to the prior quarter, 2015 vintage securitizations had the most auction activity. Similar to the previous quarter, hotels represented the majority of auctions with 15 attempted sales during Q2 2022. By market, the assets that were auctioned were geographically disperse. Only three MSAs had exposure to multiple asset auctions — Chicago, Cleveland, and New York.
CRED iQ observed insights into pricing discovery for properties that resulted from assets’ final bids. The majority of the Q2 2022 auctioned CMBS properties, approximately 70%, were appraised in 2020 or later. Excluding assets with pre-2020 appraisals, we found that 55% of the auctioned assets received final bids that were higher than most recent appraisals. One notable final bid premium over a recent appraisal was the Hilton Garden Inn Shreveport; the 142-key hotel had a final bid that was greater than 100% of its February 2022 appraisal.
When properties traded at a discount to the most recent appraisal, the average difference was approximately -24%. The most severe discount from appraisal to final bid, equal to approximately -54%, was Commerce Park IV and V, a 229,459-sf office property in the Cleveland, OH MSA. The property was liquidated during the June 2022 remittance period, resulting in a $10.4 million principal loss to CMBS certificate holders.
In summary, the average difference between final bid prices and most recent appraisals was approximately +18%. Isolating for specially serviced assets resulted in a smaller average difference of +8%. Lodging properties, on average, exhibited the highest positive difference (+47%) and office properties exhibited the highest average deficit between final bids and recent appraisals (-37%). Concerning lodging properties, many hotels were last appraised in 2020 or early-2021, which was during the immediate ascension of COVID-related disruptions when cash flows were severely impacted. Many of those reduced valuations may not have been reflective of current hotel operations if substantial recoveries in occupancy and average daily rates had occurred. As for office properties, results may be reflective of perceived property type risk for lower-tier office buildings in an environment where space availability is rising across markets and firms are continuing to shed office space.
For access to the underlying data behind this research, please contact us: team@cred-iq.com.
About CRED iQ
CRED iQ is a commercial real estate data, analytics, and valuation platform providing actionable intelligence to CRE and capital markets investors. Subscribers to CRED iQ use the platform to identify valuable leads for leasing, lending, refinancing, distressed debt, and acquisition opportunities. Our data platform is powered by over $2.0 trillion of CMBS, CRE CLO, SBLL, and GSE Agency loan and property data.
