The CRED iQ research team completed its monthly top-down evaluation of payment statuses reported for each loan, along with special servicing status. April saw CRED iQ’s Distress Rate reach a new all-time high of 8.35%.
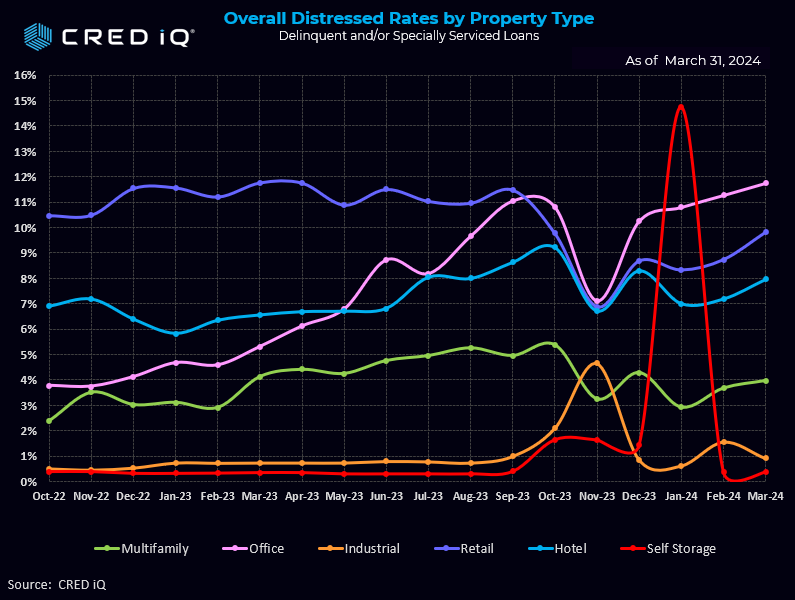
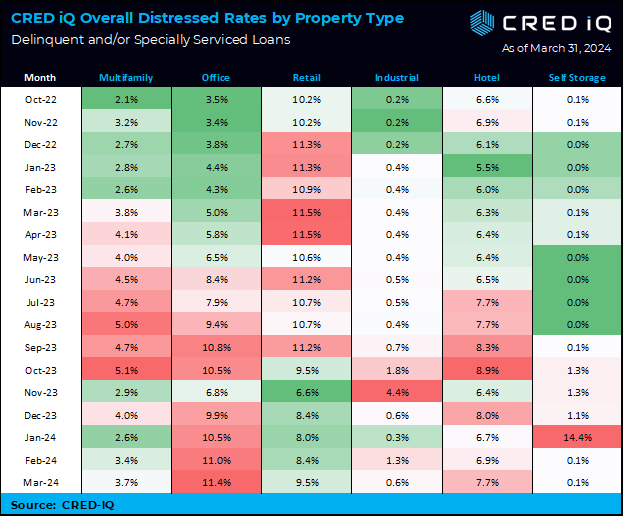
CRED iQ’s distress rate for all property types increased from 7.61% to 8.35%, a 74 basis points jump in April. The April print broke the previous distress rate record from just a month earlier. The distress rate was significantly affected by one large loan which impacted the segment distress rate in a fairly dramatic fashion.
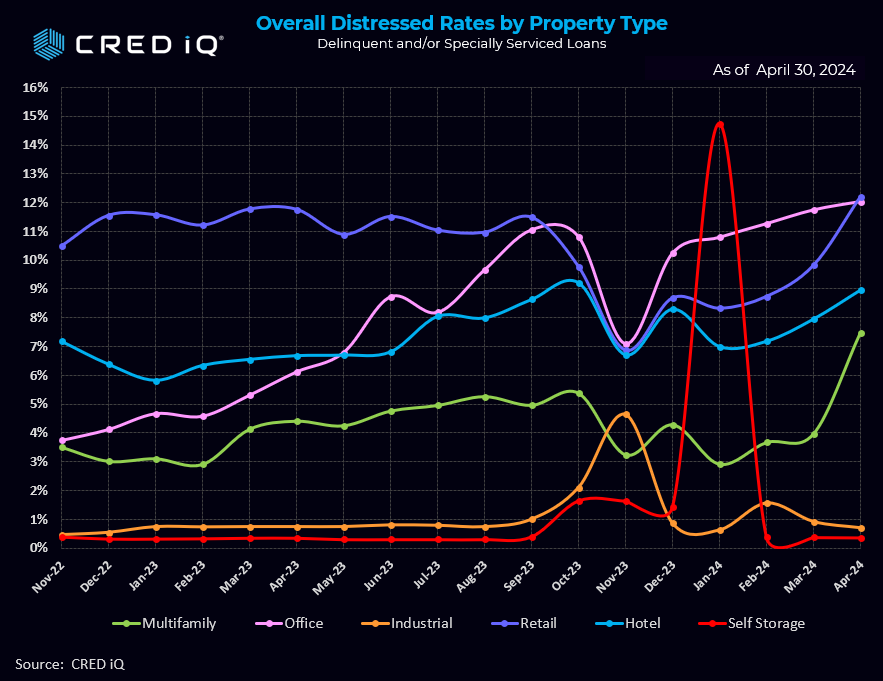
Multifamily saw a whopping increase distress rate increase – from 3.7% in the March print to 7.2% in April. The increase is mostly attributable to a $1.75 billion loan ($561,000/unit) backed by Parkmerced, a 3,221-unit multifamily property in San Francisco. Imminent non-monetary default caused the loan to transfer to the special servicer with the looming maturity date of December 2024. Furthermore, the assets have been underperforming with a below break-even DSCR of 0.47 and 83.5% occupancy. It’s important to note that CRED iQ’s distress rate factors in all CMBS properties that are securitized in conduits and single-borrower large loan deal types. CRED iQ tracks Freddie Mac, Fannie Mae, Ginnie Mae, and CRE CLO loan metrics in separate analyses.
Parkmerced consists of a mixture of townhouse and tower apartment units spanning 152 acres. Approximately 17% of the units were leased by students at origination in 2019, as the property is across the street from San Francisco State University. Parkmerced was underwritten for $2.1B ($655,076/unit) in September 2019.
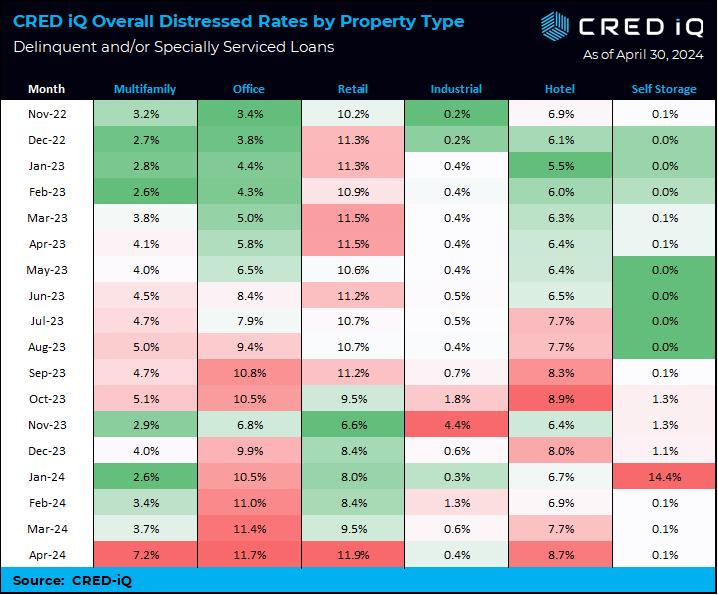
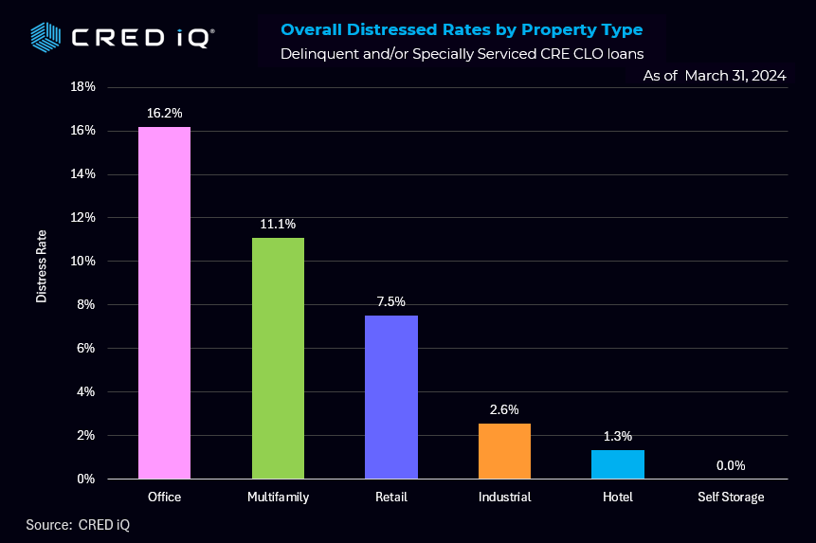
Retail’s third consecutive distress rate increase earned them the number two slot, while relinquishing their leadership position from the March report. The retail segment distress rate increased from 9.5% in March to 11.9%, achieving a record level for the segment.
The hotel segment notched the third highest month-over-month increase – gaining a full percentage point from 7.7% to 8.7%. Meanwhile, the office segment logged its fifth consecutive monthly increase by a modest 3 basis points, landing just behind retail at 11.7%.
Meanwhile, the industrial and self-storage segments continued their virtually non-existent, sub-1% distress rates
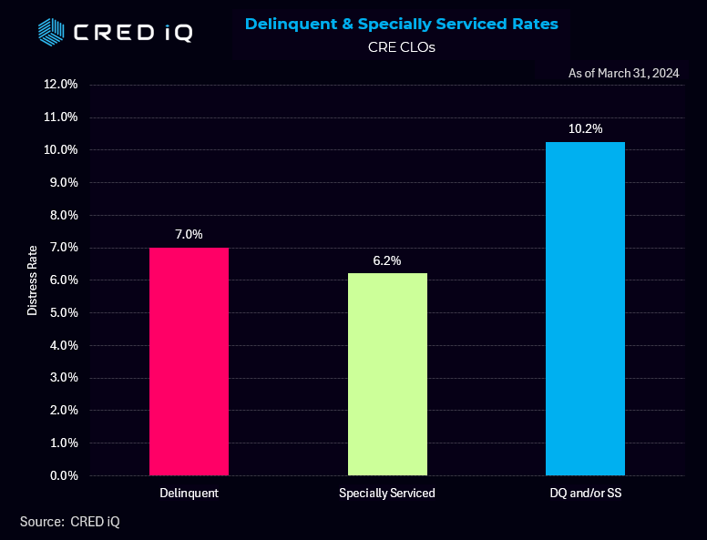
CRED iQ’s distress rate aggregates the two indicators of distress – delinquency rate and specially serviced rate – yielding the distress rate The index includes any loan with a payment status of 30+ days or worse, any loan actively with the special servicer, and includes non-performing and performing loans that have failed to pay off at maturity.
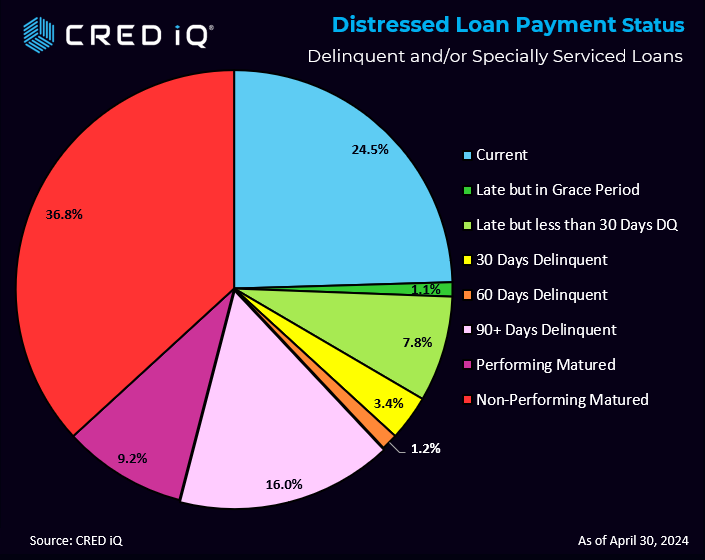
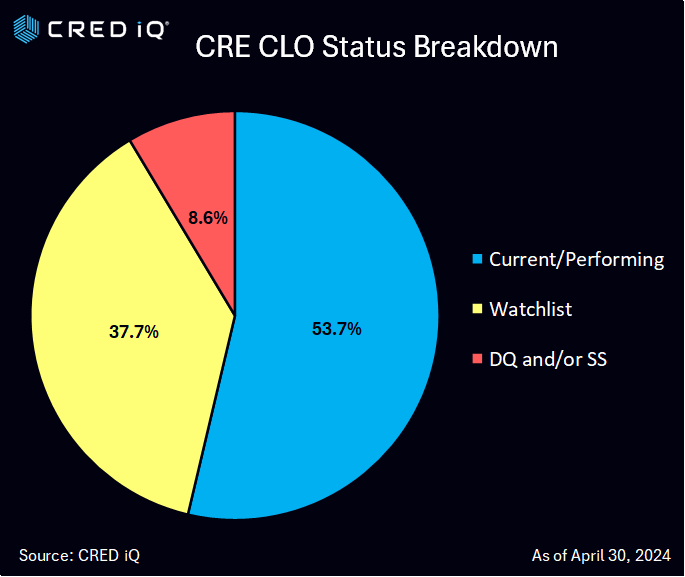
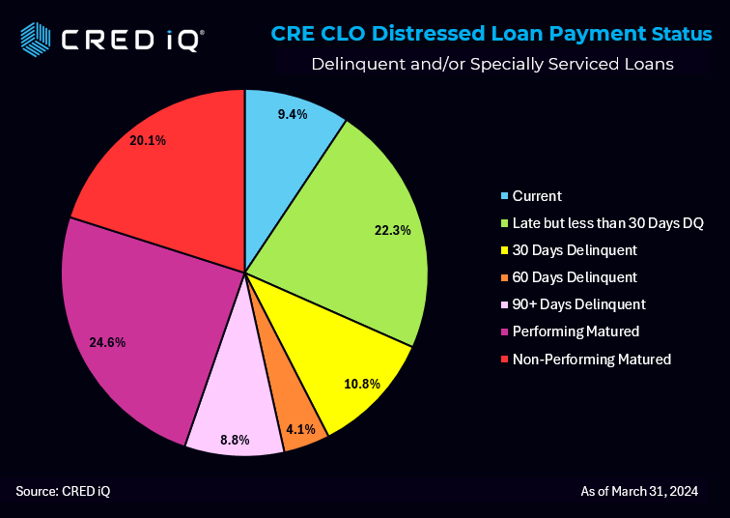
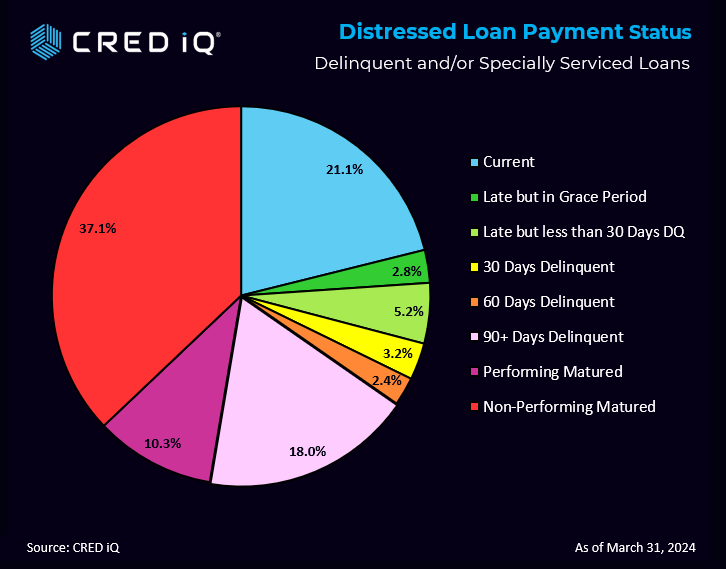
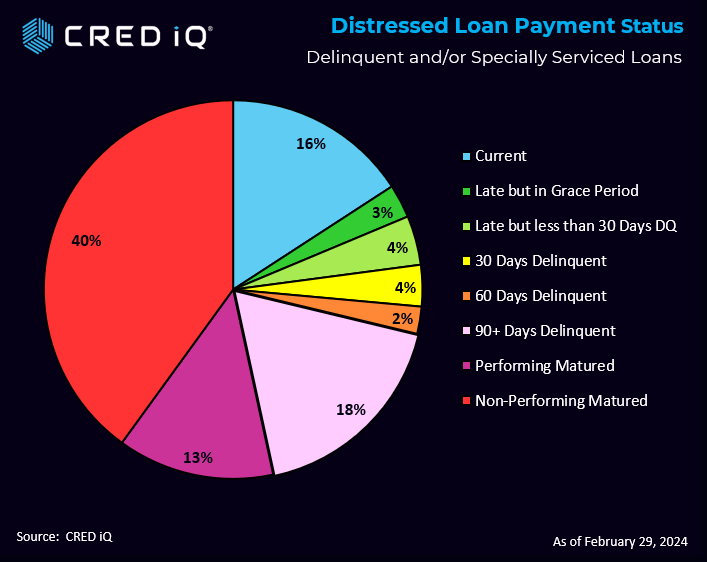
Distressed Loan Payment Status
Nearly one third of loans of the distressed loans are current or within the grace period. The largest category was non-performing, matured at 36.8%. The closely watched performing matured category represents 9.2% of the loans.
About CRED iQ
CRED iQ is a commercial real estate data, analytics, and valuation platform providing actionable intelligence to CRE and capital markets investors. Subscribers use the platform to identify valuable leads for leasing, lending, refinancing, distressed debt, and acquisition opportunities.
The platform also offers a highly efficient valuation engine which can be leveraged across all property types and geographies. Our data platform is powered by over $2.0 trillion in transactions and data covering CRE, CMBS, CRE CLO, Single Asset Single Borrower (SASB), and all of GSE / Agency.