The oft-publicized wall of maturities is at the forefront of concerns for the commercial real estate industry. In December 2022, CRED iQ highlighted $162 billion in securitized commercial real estate debt that was scheduled to mature in 2023 with its CRE Maturity Outlook at the beginning of the year. So far in the CMBS universe from January 2023 through March 2023, there has been more than $3.7 billion in new maturity defaults with loans failing to pay off on a timely basis. Further, the aggregate amount of CMBS debt in maturity default has increased by approximately 28% over the past 12 months. To provide further context and visualization into maturity risk and trends, CRED iQ completed a more granular analysis of CMBS loans in maturity default. Maturity defaults for our analysis are defined by loans whose maturity dates have passed without being paid off and continued monthly debt service is not being paid by the borrowers. Loans whose maturity dates have passed and borrowers continued remitting monthly debt servicer were excluded as well as certain floating-rate loans that were in the process of finalizing optional maturity extensions.
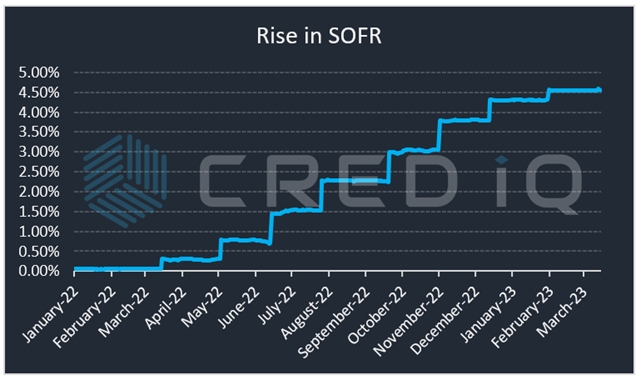
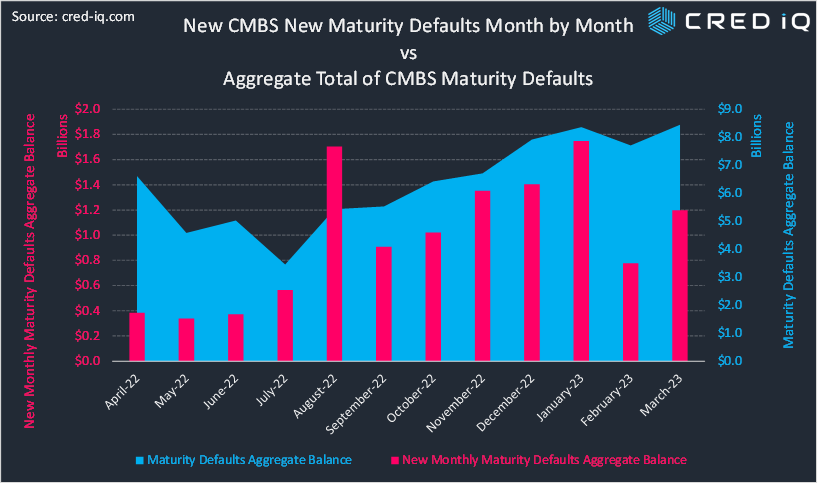
The first compilation of data is a trailing 12-month view of total CMBS maturity defaults. Although the CMBS universe is only of portion of the entire commercial real estate debt universe, the data can offer insight with a partial view of the wider population. Starting in April 2022, total CMBS maturity defaults totaled approximately $6.6 million. The aggregate total declined below $4 billion in July 2022 and then consistently and successively increased through March 2023 when the aggregate total of maturity defaults was equal to approximately $8.4 billion. Unsurprisingly, the rise in maturity defaults was concurrent with rising interest rates; though the inability to refinance debt was causally linked to idiosyncratic credit factors as well as macro trends.
A second compilation of data parsed out new CMBS maturity defaults by month. New maturity defaults are defined as loans that entered maturity default in a given month that were not in maturity default during the prior month. Monthly totals of new additions give a view of the velocity of maturity defaults over a trailing 12-month period and exhibits, on a net basis, that more debt is entering maturity default than is getting worked out of maturity default. Aside from an outlying month in August 2022, the amount of new CMBS debt entering maturity default increased in consecutive months from May 2022 through January 2023. January 2023 had the highest aggregate total of new maturity defaults over the past year with approximately $1.7 billion. New maturity defaults were significantly lower in February 2023 ($776.5 million) but increased again in March 2023 ($1.2 billion). New CMBS maturity defaults by month were overlayed with aggregate running totals to provide visual context for the increase in maturity defaults over the past year.
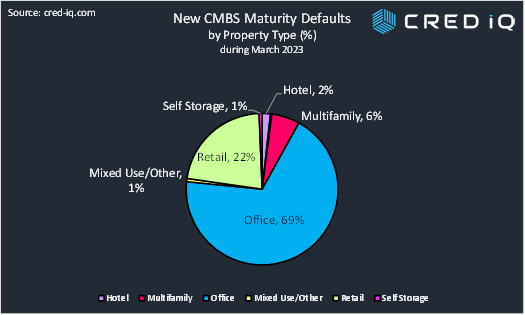
From our observations, in line with headline risk, loans secured by office properties are the primary driver behind the increase in maturity defaults over the past 12 months. Of the $1.2 billion in outstanding CMBS debt that entered maturity default during March 2023, approximately 69% was attributed to office properties. Loans secured by retail contributed to 22% of new maturity default additions by outstanding balance. The office property type anchors conversations surrounding commercial real estate credit risk with the sector facing continuously adverse headwinds. CMBS maturity defaults attributed to office properties totaled $925 million as of April 2022, but the aggregate total of office maturity defaults has increased to approximately $1.8 billion as of March 2023 — equal to a 90% increase.
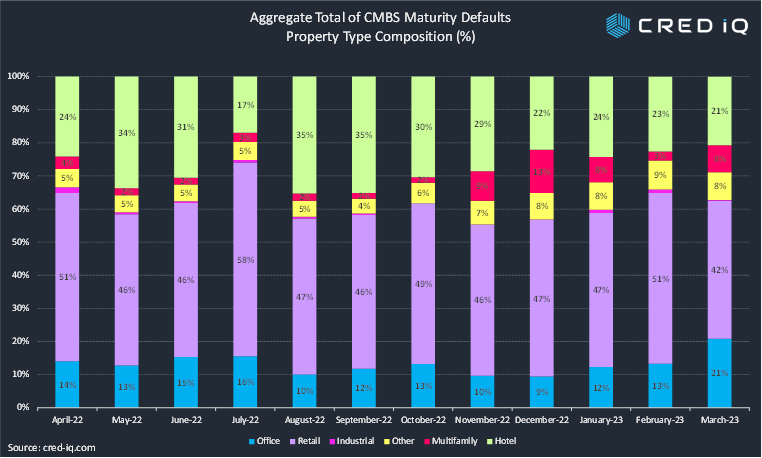
Though there has been a run up in maturity defaults by office loans, the property type historically has not accounted for the majority of outstanding CMBS debt that has been in maturity default. Over the past 12 months, loans secured by retail properties has accounted for between 42% and 58% of aggregate maturity defaults in a given month. Hotel properties generally accounted for the second-highest total, ranging from 17% to 35% of total CMBS debt in maturity default. Office loans have not accounted for more than 16% of maturity defaults in any given month between April 2022 and February 2023; however, the total increased to 21% in March 2023 with the most recent surge of office maturity defaults, surpassing the total for hotel loans.
The composition of property types among loans in maturity default will certainly change over time; however, we expect a temporary credit crunch to facilitate additional maturity defaults over the near term. Relatively recently, a $982 million mortgage secured by 34 Ashford Hospitality Trust hotels transferred to special servicing due to maturity default ahead of the loan’s June 2023 maturity date. Without a high volume of workout activity, maturity defaults may continue to mount higher.
About CRED iQ
CRED iQ is a commercial real estate data, analytics, and valuation platform providing actionable intelligence to CRE and capital markets investors. Subscribers use the platform to identify valuable leads for leasing, lending, refinancing, distressed debt, and acquisition opportunities.
The platform also offers a highly efficient valuation engine which can be leveraged across all property types and geographies. Our data platform is powered by over $2.0 trillion in transactions and data covering CRE, CMBS, CRE CLO, Single Asset Single Borrower (SASB), and all of GSE / Agency.