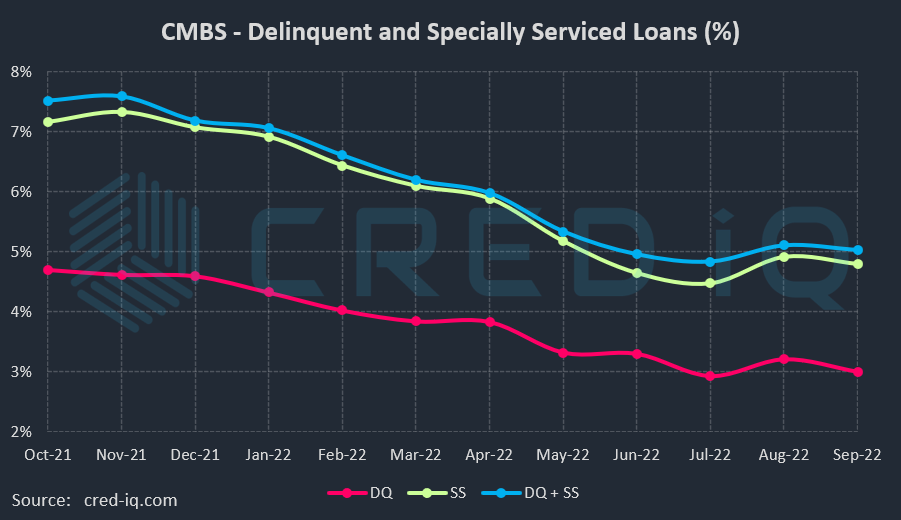
CRED iQ monitors distressed rates and market performance for nearly 400 MSAs across the United States, covering over $900 billion in outstanding commercial real estate (CRE) debt. Distressed rates (DQ + SS%) include loans that are specially serviced, delinquent, or a combination of both. Distressed rates and month-over-month changes for data reported as of September 2022 are presented below for the 50 largest MSAs, broken out by property type for a granular view of distress by market-sector.
Slightly more than half of the 50 largest MSAs tracked by CRED iQ exhibited month-over-month decreases in the percentage of distressed CRE loans within the CMBS universe. There were 27 markets, or 54% of the Top 50, with declines in distressed rates for commercial mortgages compared to the prior month. For the first time in the past three months, total markets with month-over-month improvements in distressed rates outnumbered markets with distressed rate increases. Markets with the highest level of improvements in distress included Minneapolis (-1.15%), Hartford (-0.82%), Milwaukee (-0.80%). To be fair, these three markets are also among those with the highest percentage of distressed loans overall. Conversely, the Philadelphia market (+1.95%) had the largest percentage increase in distressed commercial real estate loans during September 2022.
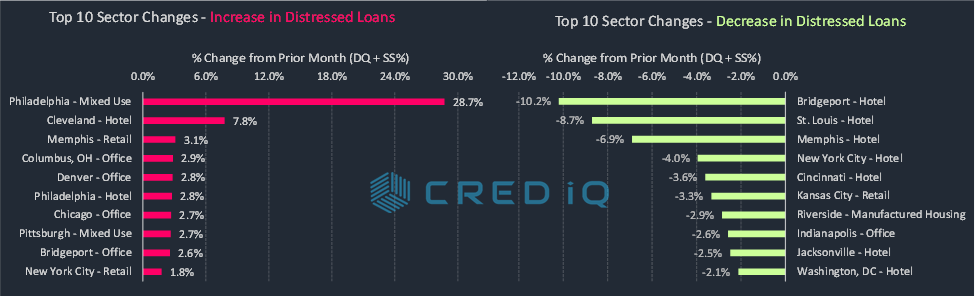
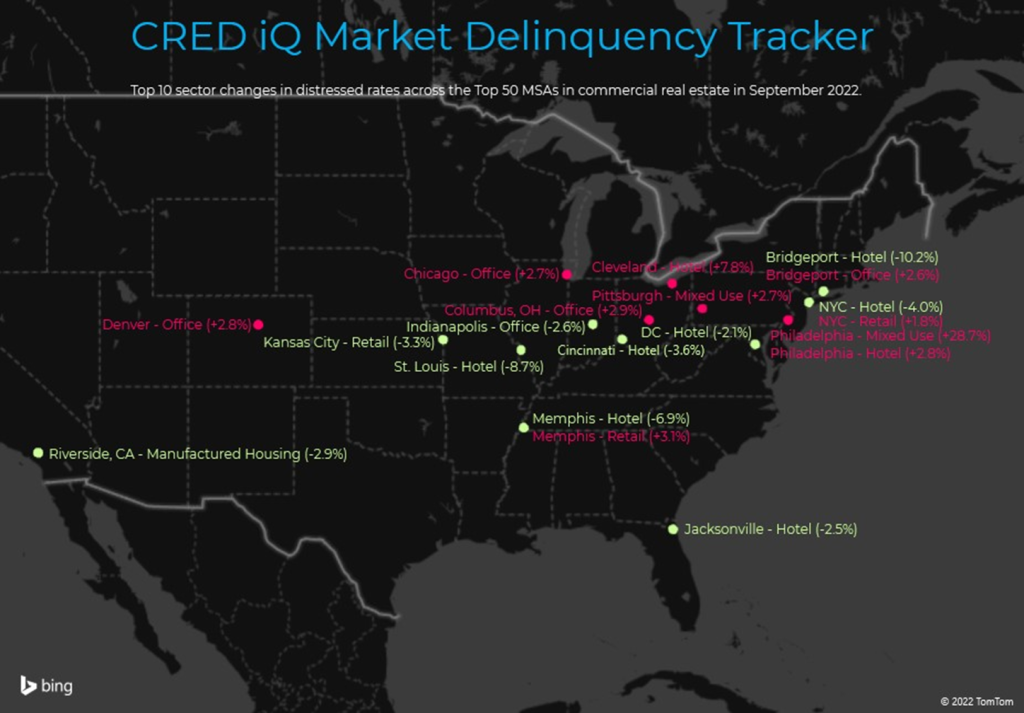
Taking a more granular analysis of the Top 50 markets, CRED iQ further delineated individual market distressed rates by property type for a market-sector view. Much of the improvement in distress across markets can be attributed to the lodging sector. The lodging property type was associated with seven of the 10 sharpest percentage declines in distressed rates across market-sectors during September 2022. There were numerous examples of loans that were rehabilitated and returned to master servicers this month after being with special servicers. Among them included the $23.6 million Embassy Suites St. Louis loan, which positively impacted the St. Louis lodging market (-8.7%), the $12.1 million HGI Memphis Wolfchase Galleria loan, which improved the Memphis hotel market (-6.9%), and the $72.6 million Holiday Inn – 6th Avenue loan, which helped lower distress in the New York City lodging market (-4.0%).
Loans secured by office properties were a common denominator among the 10 highest percentage increases in distressed loans across market-sectors. MSAs for Columbus, OH, Denver, Chicago, and Bridgeport exhibited notably high increases in office distress this month. The market-sector with the largest increase in the percentage of distressed loans was Philadelphia – Mixed Use, which equaled 30.3%. The sharp increase was caused by the $368 million 1500 Market Street loan, which transferred to special servicing in August 2022 due to maturity default. The loan is secured by a 1.8 million-sf mixed-use (office/retail) building in Center City Philadelphia.
The Minneapolis MSA has the highest overall distressed rate at 20.6%, which was a decrease compared to the prior month distressed rate of 21.8%. Cleveland (9.9%), Birmingham (9.6%), Hartford (8.6%), and Portland (8.5%) comprise the remaining markets with the highest rates of distress. Portland was a new addition to the Top 5 distressed markets this month. The Jacksonville market (0.1%) had the lowest percentage of distress among the Top 50 MSAs for the second consecutive month.
For the full CRED DQ Report, download here:
| MSA – Property Type | DQ/SS (millions) | DS/SS (%) | Monthly Change |
| Allentown-Bethlehem-Easton, PA-NJ MSA | $77.7 | 2.5% | 0.0% |
| Allentown – Hotel | $0.0 | 0.0% | 0.0% |
| Allentown – Industrial | $0.0 | 0.0% | 0.0% |
| Allentown – Multifamily | $0.0 | 0.0% | 0.0% |
| Allentown – Office | $58.6 | 19.1% | -2.1% |
| Allentown – Other | $0.0 | 0.0% | 0.0% |
| Allentown – Retail | $19.1 | 5.0% | 0.0% |
| Allentown – Self Storage | $0.0 | 0.0% | 0.0% |
| Atlanta – Atlanta-Sandy Springs-Marietta, GA MSA | $524.1 | 1.9% | 0.1% |
| Atlanta – Hotel | $140.8 | 6.9% | -0.3% |
| Atlanta – Industrial | $0.0 | 0.0% | 0.0% |
| Atlanta – Multifamily | $0.0 | 0.0% | 0.0% |
| Atlanta – Office | $69.4 | 3.3% | 0.7% |
| Atlanta – Other | $0.0 | 0.0% | 0.0% |
| Atlanta – Retail | $313.8 | 15.6% | 0.9% |
| Atlanta – Self Storage | $0.0 | 0.0% | 0.0% |
| Austin – Austin-Round Rock, TX MSA | $150.1 | 1.7% | -0.1% |
| Austin – Hotel | $50.5 | 6.4% | -1.3% |
| Austin – Industrial | $0.0 | 0.0% | 0.0% |
| Austin – Multifamily | $40.1 | 0.7% | 0.0% |
| Austin – Office | $0.0 | 0.0% | 0.0% |
| Austin – Other | $10.1 | 2.6% | 0.1% |
| Austin – Retail | $49.4 | 6.4% | 0.4% |
| Austin – Self Storage | $0.0 | 0.0% | 0.0% |
| Baltimore – Baltimore-Towson, MD MSA | $374.1 | 3.8% | -0.3% |
| Baltimore – Hotel | $50.2 | 10.6% | -1.0% |
| Baltimore – Industrial | $0.0 | 0.0% | 0.0% |
| Baltimore – Multifamily | $3.8 | 0.1% | 0.0% |
| Baltimore – Office | $57.5 | 3.3% | -0.1% |
| Baltimore – Other | $11.6 | 4.5% | 0.1% |
| Baltimore – Retail | $250.9 | 22.7% | 0.2% |
| Baltimore – Self Storage | $0.0 | 0.0% | 0.0% |
| Birmingham – Birmingham-Hoover, AL MSA | $283.0 | 9.6% | -0.1% |
| Birmingham – Hotel | $0.0 | 0.0% | 0.0% |
| Birmingham – Industrial | $0.0 | 0.0% | 0.0% |
| Birmingham – Multifamily | $2.1 | 0.2% | 0.0% |
| Birmingham – Office | $95.2 | 18.8% | 0.2% |
| Birmingham – Other | $1.2 | 4.7% | 4.7% |
| Birmingham – Retail | $184.4 | 26.2% | 0.7% |
| Birmingham – Self Storage | $0.0 | 0.0% | 0.0% |
| Boston – Boston-Cambridge-Quincy, MA-NH MSA | $131.5 | 0.7% | 0.1% |
| Boston – Hotel | $26.7 | 1.6% | 0.0% |
| Boston – Industrial | $0.0 | 0.0% | 0.0% |
| Boston – Multifamily | $0.0 | 0.0% | 0.0% |
| Boston – Office | $14.5 | 0.2% | 0.2% |
| Boston – Other | $0.0 | 0.0% | 0.0% |
| Boston – Retail | $90.2 | 8.3% | 1.4% |
| Boston – Self Storage | $0.0 | 0.0% | 0.0% |
| Bridgeport – Bridgeport-Stamford-Norwalk, CT MSA | $182.4 | 4.7% | 0.8% |
| Bridgeport – Hotel | $37.8 | 34.1% | -10.2% |
| Bridgeport – Industrial | $0.0 | 0.0% | 0.0% |
| Bridgeport – Multifamily | $0.0 | 0.0% | 0.0% |
| Bridgeport – Office | $134.8 | 12.9% | 2.6% |
| Bridgeport – Other | $9.8 | 2.5% | 0.0% |
| Bridgeport – Retail | $0.0 | 0.0% | 0.0% |
| Bridgeport – Self Storage | $0.0 | 0.0% | 0.0% |
| Charlotte – Charlotte-Gastonia-Concord, NC-SC MSA | $256.6 | 3.4% | 0.2% |
| Charlotte – Hotel | $71.4 | 7.7% | -0.4% |
| Charlotte – Industrial | $0.0 | 0.0% | 0.0% |
| Charlotte – Multifamily | $0.0 | 0.0% | 0.0% |
| Charlotte – Office | $0.0 | 0.0% | 0.0% |
| Charlotte – Other | $100.5 | 40.0% | 0.0% |
| Charlotte – Retail | $84.7 | 8.2% | 0.6% |
| Charlotte – Self Storage | $0.0 | 0.0% | 0.0% |
| Chicago – Chicago-Naperville-Joliet, IL-IN-WI MSA | $2,331.4 | 8.0% | 0.8% |
| Chicago – Hotel | $851.4 | 32.9% | 1.1% |
| Chicago – Industrial | $0.0 | 0.0% | 0.0% |
| Chicago – Multifamily | $58.9 | 0.6% | 0.0% |
| Chicago – Office | $940.3 | 11.3% | 2.7% |
| Chicago – Other | $209.0 | 8.3% | 0.1% |
| Chicago – Retail | $271.9 | 9.3% | 0.0% |
| Chicago – Self Storage | $0.0 | 0.0% | 0.0% |
| Cincinnati – Cincinnati-Middletown, OH-KY-IN MSA | $118.6 | 3.1% | 0.0% |
| Cincinnati – Hotel | $87.2 | 29.6% | -3.6% |
| Cincinnati – Industrial | $0.0 | 0.0% | 0.0% |
| Cincinnati – Multifamily | $2.3 | 0.1% | 0.0% |
| Cincinnati – Office | $0.0 | 0.0% | 0.0% |
| Cincinnati – Other | $6.8 | 2.6% | 0.1% |
| Cincinnati – Retail | $22.2 | 4.0% | 0.0% |
| Cincinnati – Self Storage | $0.0 | 0.0% | 0.0% |
| Cleveland – Cleveland-Elyria-Mentor, OH MSA | $402.4 | 9.9% | 0.3% |
| Cleveland – Hotel | $85.2 | 47.4% | 7.8% |
| Cleveland – Industrial | $0.0 | 0.0% | 0.0% |
| Cleveland – Multifamily | $5.6 | 0.3% | 0.0% |
| Cleveland – Office | $130.0 | 14.5% | -0.6% |
| Cleveland – Other | $173.9 | 43.0% | -0.2% |
| Cleveland – Retail | $7.7 | 1.1% | 0.0% |
| Cleveland – Self Storage | $0.0 | 0.0% | 0.0% |
| Columbus, OH – Columbus, OH MSA | $221.1 | 3.2% | -0.2% |
| Columbus, OH – Hotel | $37.5 | 13.4% | -11.5% |
| Columbus, OH – Industrial | $11.7 | 3.0% | -0.4% |
| Columbus, OH – Multifamily | $22.2 | 0.5% | 0.0% |
| Columbus, OH – Office | $30.2 | 4.8% | 2.9% |
| Columbus, OH – Other | $0.0 | 0.0% | 0.0% |
| Columbus, OH – Retail | $119.6 | 15.7% | 0.1% |
| Columbus, OH – Self Storage | $0.0 | 0.0% | 0.0% |
| Dallas – Dallas-Fort Worth-Arlington, TX MSA | $279.3 | 0.9% | 0.1% |
| Dallas – Hotel | $84.3 | 2.5% | -0.8% |
| Dallas – Industrial | $1.7 | 0.1% | 0.0% |
| Dallas – Multifamily | $50.4 | 0.2% | 0.1% |
| Dallas – Office | $83.4 | 2.8% | 1.3% |
| Dallas – Other | $4.9 | 0.2% | 0.0% |
| Dallas – Retail | $54.6 | 2.6% | 0.1% |
| Dallas – Self Storage | $0.0 | 0.0% | 0.0% |
| Denver – Denver-Aurora, CO MSA | $325.8 | 2.0% | 0.4% |
| Denver – Hotel | $22.8 | 2.8% | -0.3% |
| Denver – Industrial | $0.0 | 0.0% | 0.0% |
| Denver – Multifamily | $8.0 | 0.1% | 0.1% |
| Denver – Office | $182.8 | 8.9% | 2.8% |
| Denver – Other | $94.3 | 9.8% | 0.0% |
| Denver – Retail | $17.9 | 1.4% | 0.0% |
| Denver – Self Storage | $0.0 | 0.0% | 0.0% |
| Detroit – Detroit-Warren-Livonia, MI MSA | $290.4 | 2.9% | -0.4% |
| Detroit – Hotel | $103.9 | 15.5% | -2.0% |
| Detroit – Industrial | $0.0 | 0.0% | 0.0% |
| Detroit – Multifamily | $0.0 | 0.0% | 0.0% |
| Detroit – Office | $14.6 | 0.6% | -0.2% |
| Detroit – Other | $21.9 | 2.7% | 0.1% |
| Detroit – Retail | $150.0 | 10.5% | -0.5% |
| Detroit – Self Storage | $0.0 | 0.0% | 0.0% |
| Hartford – Hartford-West Hartford-East Hartford, CT MSA | $199.6 | 8.6% | -0.8% |
| Hartford – Hotel | $16.7 | 18.8% | -26.1% |
| Hartford – Industrial | $0.0 | 0.0% | 0.0% |
| Hartford – Multifamily | $0.0 | 0.0% | 0.0% |
| Hartford – Office | $25.3 | 9.5% | 0.7% |
| Hartford – Other | $0.0 | 0.0% | 0.0% |
| Hartford – Retail | $157.6 | 54.6% | 7.8% |
| Hartford – Self Storage | $0.0 | 0.0% | 0.0% |
| Houston – Houston-Sugar Land-Baytown, TX MSA | $1,047.8 | 4.4% | -0.2% |
| Houston – Hotel | $387.0 | 41.0% | -6.1% |
| Houston – Industrial | $0.0 | 0.0% | 0.0% |
| Houston – Multifamily | $26.8 | 0.2% | -0.1% |
| Houston – Office | $483.9 | 14.0% | 0.7% |
| Houston – Other | $44.3 | 6.5% | 0.0% |
| Houston – Retail | $105.8 | 2.8% | 0.0% |
| Houston – Self Storage | $0.0 | 0.0% | 0.0% |
| Indianapolis – Indianapolis-Carmel, IN MSA | $219.2 | 4.0% | -0.4% |
| Indianapolis – Hotel | $106.4 | 16.9% | -0.7% |
| Indianapolis – Industrial | $0.0 | 0.0% | 0.0% |
| Indianapolis – Multifamily | $40.4 | 1.4% | 0.0% |
| Indianapolis – Office | $61.8 | 10.5% | -2.6% |
| Indianapolis – Other | $4.9 | 1.9% | 0.0% |
| Indianapolis – Retail | $5.6 | 1.9% | 0.2% |
| Indianapolis – Self Storage | $0.0 | 0.0% | 0.0% |
| Jacksonville – Jacksonville, FL MSA | $5.0 | 0.1% | -0.2% |
| Jacksonville – Hotel | $0.0 | 0.0% | -2.5% |
| Jacksonville – Industrial | $0.0 | 0.0% | 0.0% |
| Jacksonville – Multifamily | $3.1 | 0.1% | 0.0% |
| Jacksonville – Office | $0.0 | 0.0% | 0.0% |
| Jacksonville – Other | $0.0 | 0.0% | 0.0% |
| Jacksonville – Retail | $1.9 | 0.5% | 0.0% |
| Jacksonville – Self Storage | $0.0 | 0.0% | 0.0% |
| Kansas City – Kansas City, MO-KS MSA | $120.5 | 2.2% | -0.5% |
| Kansas City – Hotel | $74.2 | 27.5% | 0.2% |
| Kansas City – Industrial | $0.0 | 0.0% | 0.0% |
| Kansas City – Multifamily | $3.8 | 0.1% | 0.0% |
| Kansas City – Office | $0.0 | 0.0% | 0.0% |
| Kansas City – Other | $21.1 | 10.3% | 0.0% |
| Kansas City – Retail | $21.3 | 3.8% | -3.3% |
| Kansas City – Self Storage | $0.0 | 0.0% | 0.0% |
| Las Vegas – Las Vegas-Paradise, NV MSA | $275.3 | 1.2% | 0.1% |
| Las Vegas – Hotel | $0.0 | 0.0% | 0.0% |
| Las Vegas – Industrial | $0.0 | 0.0% | 0.0% |
| Las Vegas – Multifamily | $45.4 | 0.7% | 0.7% |
| Las Vegas – Office | $0.0 | 0.0% | 0.0% |
| Las Vegas – Other | $0.0 | 0.0% | 0.0% |
| Las Vegas – Retail | $229.9 | 5.0% | -0.1% |
| Las Vegas – Self Storage | $0.0 | 0.0% | 0.0% |
| Los Angeles – Los Angeles-Long Beach-Santa Ana, CA MSA | $595.2 | 1.1% | 0.1% |
| Los Angeles – Hotel | $118.0 | 1.8% | 0.2% |
| Los Angeles – Industrial | $0.0 | 0.0% | 0.0% |
| Los Angeles – Multifamily | $13.3 | 0.1% | 0.0% |
| Los Angeles – Office | $62.8 | 0.6% | 0.3% |
| Los Angeles – Other | $85.3 | 2.7% | 0.1% |
| Los Angeles – Retail | $315.8 | 5.0% | 0.3% |
| Los Angeles – Self Storage | $0.0 | 0.0% | 0.0% |
| Louisville – Louisville/Jefferson County, KY-IN MSA | $72.1 | 2.7% | 0.0% |
| Louisville – Hotel | $0.0 | 0.0% | 0.0% |
| Louisville – Industrial | $0.0 | 0.0% | 0.0% |
| Louisville – Multifamily | $0.0 | 0.0% | 0.0% |
| Louisville – Office | $0.0 | 0.0% | 0.0% |
| Louisville – Other | $0.0 | 0.0% | 0.0% |
| Louisville – Retail | $72.1 | 15.6% | 0.9% |
| Louisville – Self Storage | $0.0 | 0.0% | 0.0% |
| Memphis – Memphis, TN-AR-MS MSA | $85.4 | 3.6% | 0.3% |
| Memphis – Hotel | $12.0 | 6.0% | -6.9% |
| Memphis – Industrial | $0.0 | 0.0% | 0.0% |
| Memphis – Multifamily | $6.9 | 0.6% | 0.0% |
| Memphis – Office | $0.0 | 0.0% | 0.0% |
| Memphis – Other | $5.4 | 17.2% | 1.2% |
| Memphis – Retail | $61.1 | 16.4% | 3.1% |
| Memphis – Self Storage | $0.0 | 0.0% | 0.0% |
| Miami – Miami-Fort Lauderdale-Pompano Beach, FL MSA | $268.7 | 1.1% | -0.2% |
| Miami – Hotel | $11.0 | 0.2% | 0.0% |
| Miami – Industrial | $0.0 | 0.0% | 0.0% |
| Miami – Multifamily | $0.0 | 0.0% | 0.0% |
| Miami – Office | $4.0 | 0.2% | 0.0% |
| Miami – Other | $8.8 | 0.6% | 0.0% |
| Miami – Retail | $245.0 | 4.5% | -0.7% |
| Miami – Self Storage | $0.0 | 0.0% | 0.0% |
| Milwaukee – Milwaukee-Waukesha-West Allis, WI MSA | $196.3 | 8.3% | -0.8% |
| Milwaukee – Hotel | $5.6 | 4.0% | -12.1% |
| Milwaukee – Industrial | $0.0 | 0.0% | 0.0% |
| Milwaukee – Multifamily | $0.0 | 0.0% | 0.0% |
| Milwaukee – Office | $83.1 | 16.9% | -0.9% |
| Milwaukee – Other | $0.6 | 0.5% | 0.0% |
| Milwaukee – Retail | $107.0 | 25.2% | 1.8% |
| Milwaukee – Self Storage | $0.0 | 0.0% | 0.0% |
| Minneapolis – Minneapolis-St. Paul-Bloomington, MN-WI MSA | $1,728.4 | 20.6% | -1.1% |
| Minneapolis – Hotel | $223.9 | 40.0% | -5.2% |
| Minneapolis – Industrial | $0.0 | 0.0% | 0.0% |
| Minneapolis – Multifamily | $0.0 | 0.0% | 0.0% |
| Minneapolis – Office | $92.2 | 4.4% | -0.3% |
| Minneapolis – Other | $4.1 | 1.0% | 0.0% |
| Minneapolis – Retail | $1,408.2 | 77.3% | -0.3% |
| Minneapolis – Self Storage | $0.0 | 0.0% | 0.0% |
| Nashville – Nashville-Davidson-Murfreesboro-Franklin, TN MSA | $68.4 | 1.1% | 0.0% |
| Nashville – Hotel | $59.0 | 4.5% | -0.2% |
| Nashville – Industrial | $0.0 | 0.0% | 0.0% |
| Nashville – Multifamily | $0.0 | 0.0% | 0.0% |
| Nashville – Office | $0.0 | 0.0% | 0.0% |
| Nashville – Other | $0.0 | 0.0% | 0.0% |
| Nashville – Retail | $9.4 | 1.3% | 0.0% |
| Nashville – Self Storage | $0.0 | 0.0% | 0.0% |
| New Orleans – New Orleans-Metairie-Kenner, LA MSA | $124.3 | 3.7% | -0.3% |
| New Orleans – Hotel | $60.0 | 5.5% | -0.7% |
| New Orleans – Industrial | $0.0 | 0.0% | 0.0% |
| New Orleans – Multifamily | $0.0 | 0.0% | -0.9% |
| New Orleans – Office | $27.2 | 5.0% | -0.2% |
| New Orleans – Other | $14.8 | 10.1% | 0.5% |
| New Orleans – Retail | $22.2 | 3.7% | 0.5% |
| New Orleans – Self Storage | $0.0 | 0.0% | 0.0% |
| New York City – New York-Northern New Jersey-Long Island, NY-NJ-PA MSA | $5,239.6 | 4.1% | -0.1% |
| New York City – Hotel | $920.0 | 24.0% | -4.0% |
| New York City – Industrial | $64.7 | 1.6% | -0.8% |
| New York City – Multifamily | $192.8 | 0.5% | -0.2% |
| New York City – Office | $1,409.4 | 3.1% | -0.3% |
| New York City – Other | $1,439.8 | 6.2% | 0.4% |
| New York City – Retail | $1,213.0 | 9.9% | 1.8% |
| New York City – Self Storage | $0.0 | 0.0% | 0.0% |
| Orlando – Orlando-Kissimmee, FL MSA | $179.7 | 1.8% | 0.0% |
| Orlando – Hotel | $84.6 | 3.2% | 0.2% |
| Orlando – Industrial | $0.0 | 0.0% | 0.0% |
| Orlando – Multifamily | $0.0 | 0.0% | 0.0% |
| Orlando – Office | $47.0 | 10.6% | -2.0% |
| Orlando – Other | $0.0 | 0.0% | 0.0% |
| Orlando – Retail | $48.1 | 5.2% | 0.9% |
| Orlando – Self Storage | $0.0 | 0.0% | 0.0% |
| Philadelphia – Philadelphia-Camden-Wilmington, PA-NJ-DE-MD MSA | $671.1 | 3.3% | 2.0% |
| Philadelphia – Hotel | $106.0 | 12.0% | 2.8% |
| Philadelphia – Industrial | $0.0 | 0.0% | 0.0% |
| Philadelphia – Multifamily | $41.4 | 0.5% | 0.0% |
| Philadelphia – Office | $115.9 | 3.2% | -0.1% |
| Philadelphia – Other | $388.5 | 30.3% | 28.7% |
| Philadelphia – Retail | $19.3 | 0.9% | 0.0% |
| Philadelphia – Self Storage | $0.0 | 0.0% | 0.0% |
| Phoenix – Phoenix-Mesa-Scottsdale, AZ MSA | $268.4 | 1.4% | 0.2% |
| Phoenix – Hotel | $23.4 | 1.5% | -0.7% |
| Phoenix – Industrial | $0.0 | 0.0% | 0.0% |
| Phoenix – Multifamily | $60.6 | 0.5% | 0.5% |
| Phoenix – Office | $40.9 | 1.9% | 0.1% |
| Phoenix – Other | $8.6 | 1.3% | 0.2% |
| Phoenix – Retail | $134.9 | 8.3% | 0.0% |
| Phoenix – Self Storage | $0.0 | 0.0% | 0.0% |
| Pittsburgh – Pittsburgh, PA MSA | $65.0 | 1.4% | 0.4% |
| Pittsburgh – Hotel | $15.9 | 8.7% | -0.9% |
| Pittsburgh – Industrial | $0.0 | 0.0% | 0.0% |
| Pittsburgh – Multifamily | $0.0 | 0.0% | 0.0% |
| Pittsburgh – Office | $30.6 | 3.2% | 0.9% |
| Pittsburgh – Other | $18.5 | 4.6% | 2.7% |
| Pittsburgh – Retail | $0.0 | 0.0% | 0.0% |
| Pittsburgh – Self Storage | $0.0 | 0.0% | 0.0% |
| Portland – Portland-Vancouver-Beaverton, OR-WA MSA | $586.0 | 8.5% | -0.3% |
| Portland – Hotel | $357.0 | 39.4% | -4.9% |
| Portland – Industrial | $0.0 | 0.0% | 0.0% |
| Portland – Multifamily | $0.0 | 0.0% | 0.0% |
| Portland – Office | $12.9 | 3.0% | -0.2% |
| Portland – Other | $0.0 | 0.0% | 0.0% |
| Portland – Retail | $216.0 | 43.1% | 0.6% |
| Portland – Self Storage | $0.0 | 0.0% | 0.0% |
| Raleigh – Raleigh-Cary, NC MSA | $21.9 | 0.6% | 0.0% |
| Raleigh – Hotel | $15.3 | 7.4% | -1.2% |
| Raleigh – Industrial | $0.0 | 0.0% | 0.0% |
| Raleigh – Multifamily | $0.0 | 0.0% | 0.0% |
| Raleigh – Office | $0.0 | 0.0% | 0.0% |
| Raleigh – Other | $6.7 | 4.6% | 0.2% |
| Raleigh – Retail | $0.0 | 0.0% | 0.0% |
| Raleigh – Self Storage | $0.0 | 0.0% | 0.0% |
| Richmond – Richmond, VA MSA | $67.4 | 2.1% | 0.0% |
| Richmond – Hotel | $0.0 | 0.0% | 0.0% |
| Richmond – Industrial | $0.0 | 0.0% | 0.0% |
| Richmond – Multifamily | $0.0 | 0.0% | 0.0% |
| Richmond – Office | $0.0 | 0.0% | 0.0% |
| Richmond – Other | $13.0 | 8.9% | 0.0% |
| Richmond – Retail | $54.4 | 11.9% | 0.8% |
| Richmond – Self Storage | $0.0 | 0.0% | 0.0% |
| Riverside – Riverside-San Bernardino-Ontario, CA MSA | $279.5 | 2.7% | -0.2% |
| Riverside – Hotel | $51.1 | 10.5% | -1.8% |
| Riverside – Industrial | $0.0 | 0.0% | 0.0% |
| Riverside – Multifamily | $0.0 | 0.0% | 0.0% |
| Riverside – Office | $0.0 | 0.0% | 0.0% |
| Riverside – Other | $0.0 | 0.0% | -2.9% |
| Riverside – Retail | $228.4 | 11.3% | 0.2% |
| Riverside – Self Storage | $0.0 | 0.0% | 0.0% |
| Sacramento – Sacramento-Arden-Arcade-Roseville, CA MSA | $16.6 | 0.3% | 0.0% |
| Sacramento – Hotel | $5.6 | 1.4% | -0.3% |
| Sacramento – Industrial | $0.0 | 0.0% | 0.0% |
| Sacramento – Multifamily | $0.0 | 0.0% | 0.0% |
| Sacramento – Office | $0.0 | 0.0% | 0.0% |
| Sacramento – Other | $11.0 | 2.8% | 0.0% |
| Sacramento – Retail | $0.0 | 0.0% | 0.0% |
| Sacramento – Self Storage | $0.0 | 0.0% | 0.0% |
| Salt Lake City – Salt Lake City, UT MSA | $21.0 | 0.5% | 0.0% |
| Salt Lake City – Hotel | $21.0 | 7.4% | -0.4% |
| Salt Lake City – Industrial | $0.0 | 0.0% | 0.0% |
| Salt Lake City – Multifamily | $0.0 | 0.0% | 0.0% |
| Salt Lake City – Office | $0.0 | 0.0% | 0.0% |
| Salt Lake City – Other | $0.0 | 0.0% | 0.0% |
| Salt Lake City – Retail | $0.0 | 0.0% | 0.0% |
| Salt Lake City – Self Storage | $0.0 | 0.0% | 0.0% |
| San Antonio – San Antonio, TX MSA | $140.9 | 2.3% | 0.0% |
| San Antonio – Hotel | $16.4 | 6.7% | -0.2% |
| San Antonio – Industrial | $0.0 | 0.0% | 0.0% |
| San Antonio – Multifamily | $7.9 | 0.2% | 0.0% |
| San Antonio – Office | $0.0 | 0.0% | 0.0% |
| San Antonio – Other | $0.0 | 0.0% | 0.0% |
| San Antonio – Retail | $116.6 | 20.2% | 0.7% |
| San Antonio – Self Storage | $0.0 | 0.0% | 0.0% |
| San Diego – San Diego-Carlsbad-San Marcos, CA MSA | $55.8 | 0.5% | 0.0% |
| San Diego – Hotel | $39.4 | 2.0% | -0.1% |
| San Diego – Industrial | $0.0 | 0.0% | 0.0% |
| San Diego – Multifamily | $4.2 | 0.1% | 0.0% |
| San Diego – Office | $0.0 | 0.0% | 0.0% |
| San Diego – Other | $9.3 | 1.3% | 0.0% |
| San Diego – Retail | $2.9 | 0.2% | 0.0% |
| San Diego – Self Storage | $0.0 | 0.0% | 0.0% |
| San Francisco – San Francisco-Oakland-Fremont, CA MSA | $201.6 | 0.8% | 0.0% |
| San Francisco – Hotel | $109.0 | 4.5% | -1.0% |
| San Francisco – Industrial | $0.0 | 0.0% | 0.0% |
| San Francisco – Multifamily | $0.0 | 0.0% | 0.0% |
| San Francisco – Office | $0.0 | 0.0% | 0.0% |
| San Francisco – Other | $38.6 | 1.4% | 0.0% |
| San Francisco – Retail | $54.0 | 4.5% | 0.5% |
| San Francisco – Self Storage | $0.0 | 0.0% | 0.0% |
| San Jose – San Jose-Sunnyvale-Santa Clara, CA MSA | $32.0 | 0.2% | -0.2% |
| San Jose – Hotel | $32.0 | 0.5% | -0.6% |
| San Jose – Industrial | $0.0 | 0.0% | 0.0% |
| San Jose – Multifamily | $0.0 | 0.0% | 0.0% |
| San Jose – Office | $0.0 | 0.0% | 0.0% |
| San Jose – Other | $0.0 | 0.0% | 0.0% |
| San Jose – Retail | $0.0 | 0.0% | 0.0% |
| San Jose – Self Storage | $0.0 | 0.0% | 0.0% |
| Seattle – Seattle-Tacoma-Bellevue, WA MSA | $73.5 | 0.3% | -0.1% |
| Seattle – Hotel | $73.5 | 5.3% | -1.4% |
| Seattle – Industrial | $0.0 | 0.0% | 0.0% |
| Seattle – Multifamily | $0.0 | 0.0% | 0.0% |
| Seattle – Office | $0.0 | 0.0% | 0.0% |
| Seattle – Other | $0.0 | 0.0% | 0.0% |
| Seattle – Retail | $0.0 | 0.0% | 0.0% |
| Seattle – Self Storage | $0.0 | 0.0% | 0.0% |
| St. Louis – St. Louis, MO-IL MSA | $205.1 | 4.9% | -0.7% |
| St. Louis – Hotel | $1.7 | 0.6% | -8.7% |
| St. Louis – Industrial | $0.0 | 0.0% | 0.0% |
| St. Louis – Multifamily | $0.0 | 0.0% | -0.4% |
| St. Louis – Office | $0.0 | 0.0% | 0.0% |
| St. Louis – Other | $19.6 | 4.0% | 0.0% |
| St. Louis – Retail | $183.8 | 19.4% | -0.3% |
| St. Louis – Self Storage | $0.0 | 0.0% | 0.0% |
| Tampa – Tampa-St. Petersburg-Clearwater, FL | $133.7 | 1.5% | 0.0% |
| Tampa – Hotel | $59.1 | 8.6% | -0.9% |
| Tampa – Industrial | $0.0 | 0.0% | 0.0% |
| Tampa – Multifamily | $0.0 | 0.0% | 0.0% |
| Tampa – Office | $23.5 | 3.6% | 0.1% |
| Tampa – Other | $0.0 | 0.0% | 0.0% |
| Tampa – Retail | $51.1 | 7.0% | 0.3% |
| Tampa – Self Storage | $0.0 | 0.0% | 0.0% |
| Tucson – Tucson, AZ MSA | $159.3 | 4.8% | -0.1% |
| Tucson – Hotel | $0.0 | 0.0% | -1.4% |
| Tucson – Industrial | $0.0 | 0.0% | 0.0% |
| Tucson – Multifamily | $0.0 | 0.0% | 0.0% |
| Tucson – Office | $0.0 | 0.0% | 0.0% |
| Tucson – Other | $0.0 | 0.0% | 0.0% |
| Tucson – Retail | $159.3 | 19.9% | 0.7% |
| Tucson – Self Storage | $0.0 | 0.0% | 0.0% |
| Virginia Beach – Virginia Beach-Norfolk-Newport News, VA-NC MSA | $185.0 | 4.0% | 0.0% |
| Virginia Beach – Hotel | $0.0 | 0.0% | 0.0% |
| Virginia Beach – Industrial | $21.2 | 8.0% | 0.0% |
| Virginia Beach – Multifamily | $0.0 | 0.0% | -0.2% |
| Virginia Beach – Office | $0.0 | 0.0% | -0.3% |
| Virginia Beach – Other | $0.0 | 0.0% | 0.0% |
| Virginia Beach – Retail | $163.8 | 22.9% | 1.3% |
| Virginia Beach – Self Storage | $0.0 | 0.0% | 0.0% |
| Washington, DC – Washington-Arlington-Alexandria, DC-VA-MD-WV MSA | $534.2 | 1.8% | 0.2% |
| Washington, DC – Hotel | $49.0 | 4.4% | -2.1% |
| Washington, DC – Industrial | $0.0 | 0.0% | 0.0% |
| Washington, DC – Multifamily | $0.0 | 0.0% | 0.0% |
| Washington, DC – Office | $377.6 | 4.9% | 1.4% |
| Washington, DC – Other | $32.9 | 2.0% | 0.0% |
| Washington, DC – Retail | $74.8 | 2.2% | -0.8% |
| Washington, DC – Self Storage | $0.0 | 0.0% | 0.0% |
| Grand Total | $20,091.9 | 2.9% | 0.1% |
About CRED iQ
CRED iQ is a commercial real estate data, analytics, and valuation platform providing actionable intelligence to CRE and capital markets investors. Subscribers to CRED iQ use the platform to identify valuable leads for leasing, lending, refinancing, distressed debt, and acquisition opportunities. Our data platform is powered by over $2.0 trillion of CMBS, CRE CLO, SBLL, Ginnie Mae, FHA/HUD, and Freddie Mac loan and property data.