RADNOR, Pa., March 9, 2022 /PRNewswire/ CRED iQ, a data, analytics and valuation platform serving the commercial real estate finance and investment communities today announced the partnership and data integration with Cherre. Mutual clients of CRED iQ and Cherre can now easily add commercial real estate data to their Cherre data warehouse for better insights.
Cherre seamlessly connects disparate real estate data into a single source of truth, empowering companies to instantly explore all their connected data for immediate and actionable insight.
CRED iQ is a commercial real estate data, analytics, and valuation platform providing actionable intelligence to CRE brokers, lender, and investors in every market. It tracks maturing loans, expiring leases, detailed quarterly and annual financial operating statements, delinquent loans, newly issued loans, foreclosures, and REO. CRED iQ also maintains borrower and ownership contact information including names, phone numbers, emails, and addresses.
Subscribers to CRED iQ use the platform to identify valuable leads for leasing, lending, refinancing, distressed debt, and acquisition opportunities. Access CRED iQ with a free 7-day, full-access trial by clicking here.
About CRED iQ
CRED iQ is a commercial real estate data, analytics, and valuation platform providing actionable intelligence to CRE and capital markets investors. The data platform is powered by over $2.0 trillion of CMBS, CRE CLO, SASB, and GSE/Agency loan and property data.
About Cherre
Cherre is the leader in real estate data and insight. We connect decision makers to accurate property and market information, and help them make faster, smarter decisions. By providing a unique “single source of truth,” Cherre empowers customers to evaluate opportunities and trends faster and more accurately, while saving millions of dollars in manual data collection and analytics costs. Cherre launched in 2016 and is located in New York City.
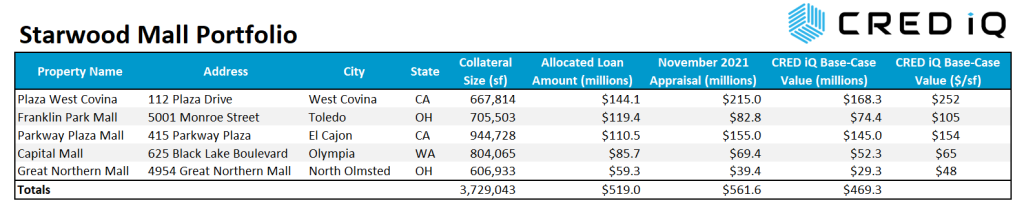
This week, CRED iQ calculated real-time valuations for 5 regional malls that secure $519 million in outstanding mortgage debt. The portfolio has been featured in news headlines extensively over the past few years due to its credit-related struggles and, most recently, was mentioned in a Wall Street Journal article last week after the Israel Securities Authority announced it would back a class-action lawsuit alleging mispresented risks related to unsecured debt that traded on the Tel Aviv Stock Exchange.
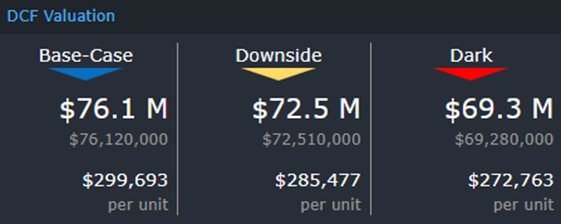
For background, the floating-rate mortgage had an original balance of $549 million and was originated in 2018 with a 3-year term and 2, 12-month extension options. The mortgage secures the GSMS 2018-SRP5 single-asset CMBS transaction. The loan is secured by 5 regional malls located in California, Ohio, and Washington. In addition to the mortgage, the Starwood-controlled borrowing entity, which also had equity in two other regional malls outside of this portfolio, incurred additional unsecured debt in the form of ₪910 million issued in Israel, which was equal to approximately $255 million at the time of the securitization of the mortgage. Bond offerings associated with the unsecured debt are the subject of the class-action lawsuit previously mentioned. The mortgage loan has been in special servicing since June 2020, but updated commentary from the servicer indicates the loan may soon return to the master servicer as a corrected mortgage. Following credit issues with the unsecured debt, the Starwood-controlled borrowing entity was taken over by a trustee and Pacific Retail Partners was installed as property manager. The mortgage was modified in June 2021, which in part, extended the loan’s maturity date to December 2025. With consideration for the debt stack and governance issues associated with the mortgage loan, this week’s WAR Report takes a closer look at the underlying value of the collateral malls.
Starwood Mall Portfolio – GSMS 2018-SRP5
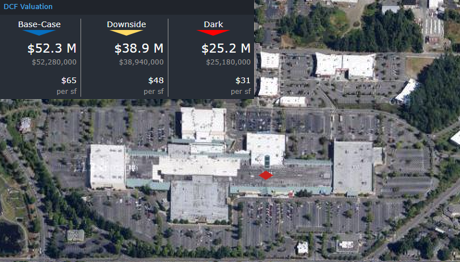
CRED iQ valuations factor in a base-case (most likely), a downside (significant loss of tenants), and dark scenarios (100% vacant). For full access to the valuation reports as well as full CMBS loan reporting, with detailed financials, updated tenant information, and borrower contact information, sign up for a free trial here.
Plaza West Covina
1.2 million sf, Regional Mall, West Covina, CA [View Details]
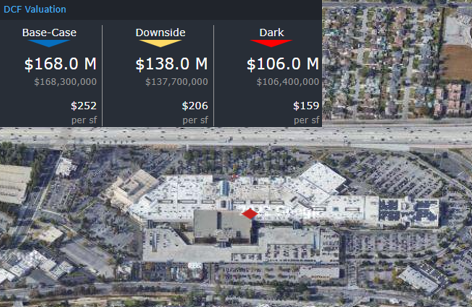
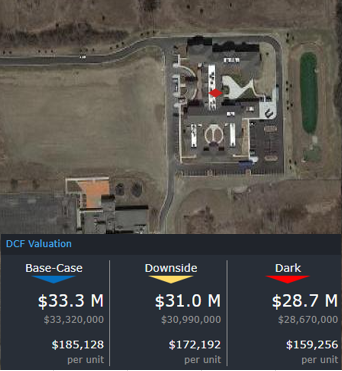
Plaza West Covina is a regional mall located about 20 miles east of downtown Los Angeles. The mall is the most valuable within the five-property portfolio and is well positioned in terms of its urban infill location and surrounding demographics. Only a 667,814-sf portion of the mall is collateral for the $519 million mortgage, of which $144.1 million of the debt is allocated to Plaza West Covina. The mall was appraised just prior to loan origination in 2018 for $343 million, equal to $514/sf, but an updated appraisal of $215 million, equal to $322/sf, was reported as of November 2021. The updated appraisal for Plaza West Covina reflected a 37% decline in value since loan origination.
Aside from the secular changes in retail that have plagued regional malls, specific events that impacted Plaza West Covina include the closure of Sears and the departure of 2 of the mall’s 10 largest tenants by percentage of base rent — La Amapola, a restaurant, and The Disney Store. The vacated spaces do not appear to have been backfilled yet; however, the vacant Sears box, which does not serve as collateral for the mortgage, may be a source of optimism for the property. The owner of the vacant Sears parcel, Seritage Growth Properties, is moving forward with a residential development to replace the empty parcel. This example of manufacturing of demand and foot traffic for the property by way of building multifamily and residential is one method of counteracting weaker fundamentals for regional malls.
With limited mall transactions taking place in recent years, one of CRED iQ’s comps for Plaza West Covina is the 2021 sale of Eagle Rock Plaza, a 466,000-sf Los Angeles-area mall that sold for $76 million, equal to $164/sf. Eagle Rock Plaza is inferior to Plaza West Covina in many aspects of viability as a regional mall and was also REO at the time of sale, which qualifies the transaction as a distressed sale and serves as a potential low watermark for Plaza West Covina on a price per square foot basis. Unibail-Rodamco-Westfield’s Santa Anita Mall and CIM Group’s Montclair Plaza fall within the competitive set for Plaza West Covina as well. For the full valuation report and property-level details, click here.
JCPenney Macy’s Residential Development (former Sears)
Key Collateral Tenants
Best Buy Nordstrom Rack Gold’s Gym
Most Recent Appraisal
$215,000,000 ($322/sf)
Most Recent Appraisal Date
11/20/2021
Franklin Park Mall
1.3 million sf, Regional Mall, Toledo, OH [View Details]
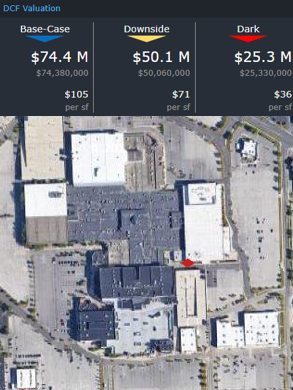
Franklin Park Mall is located in suburban Toledo, OH, approximately 6 miles outside of downtown. The mall, of which only 705,503 sf serves as collateral for the mortgage, has the second-highest amount of debt allocated to it in the amount of $119.4 million. Prior to loan origination, the mall was appraised for $284 million, equal to $403/sf. An updated November 2021 appraisal valued the property at $82.8 million, which was equal to $117/sf and represented a 71% decline in value since 2018. The decline in appraisal values from origination to 2021 was the second-largest among the five malls in the portfolio.
The highlight of Franklin Park Mall’s tenant roster is an Apple Store, which serves as primary driver of foot traffic for the property. The next closest Apple Store is located about 40 miles north at Simon Property Group’s Briarwood Mall in Ann Arbor, MI. In terms of traditional box anchors, Franklin Park Mall features a JCPenney, Dillard’s, and Macy’s; although, none of these parcels serve as collateral for the mortgage. The mall has also had some evolution in the make up of its in-line tenants after the departures of some national brands, such as Banana Republic, and the opening of a few locally-owned tenants.
In addition to Briarwood Mall, another one of CRED iQ’s comps for Franklin Park Mall is Brookfield Properties’ Glenbrook Square Mall, which is located in Fort Wayne, IN. This 1 million-sf mall was appraised in October 2021 for a value of $104 million, equal to $104/sf. Comparatively speaking, Glenbrook Square only has a JCPenney and a Macy’s as operational anchors and does not have an Apple Store. However, both Briarwood Mall and Glenbrook Square Mall fall within the competitive set for Franklin Park Mall. For the full valuation report and property-level details, click here.
1.3 million sf, Regional Mall, El Cajon, CA [View Details]
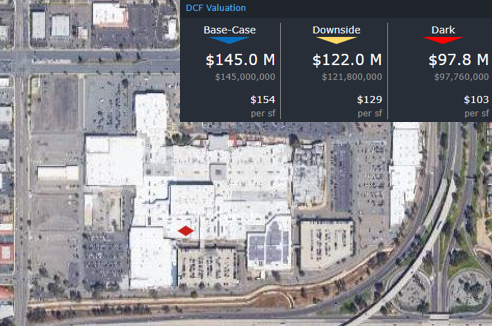
Parkway Plaza is a regional mall located within the San Diego MSA in El Cajon, CA, which is approximately 15 miles east of the Pacific Coast. The mall is the second-most valuable of the portfolio on a price per square foot basis. Of the mall’s total 1.3 million-sf footprint, only 944,728 sf is collateral for the mortgage. The property has approximately $110.5 million of the total mortgage debt allocated to it. A November 2021 appraisal valued the property at $155 million, equal to $164/sf. The updated appraisal represented a 41% decline from an appraisal value of $263 million, equal to $278/sf, from prior to loan origination.
The mall’s primary tenant and anchor is Walmart, which leases 160,000 sf, or about 17% of the property’s NRA, pursuant to a lease that expires in October 2024. With Walmart’s lease expiration less than 3 years away, the probability of a lease renewal is a key factor in evaluating the mall’s performance over the near to intermediate term. There are 4 other Walmart locations within a 5-mile radius of the Parkway Plaza location.
CRED iQ’s competitive set for Parkway Plaza Mall includes Unibail-Rodamco-Westfield’s Mission Valley Mall, located 12 miles west in a more central location to San Diego’s central business district. The Mission Valley Mall features a Target, Macy’s, and Bed Bath & Beyond.
Parkway Plaza Mall features traditional anchor boxes in the form of JCPenney and Macy’s, but neither of the buildings serve as a collateral for the loan. A positive attribute for the mall is the redevelopment by Seritage Growth Properties of a formerly vacant Sears parcel into a multi-tenant retail complex that features Burlington, Bob’s Discount Furniture, and an Ashley Homestore. For the full valuation report and property level-details, click here.
804,065 sf, Regional Mall, Olympia, WA [View Details]
Capital Mall is located in Olympia, WA, approximately 65 miles southwest of Seattle, WA. Approximately $85.7 million of the total mortgage amount is allocated to the mall. The property features a traditional single-story linear layout of enclosed stores as well as several walk-up outparcel buildings located just north of the mall loop. The property was appraised for $204 million, equal to $254/sf, prior to loan origination but an updated appraisal from November 2021 stated a value of $69.4 million, equal to $86/sf. The difference in appraisal values is equal to a 66% decline.
Capital Mall has two traditional anchor boxes, Macy’s and JCPenney, as well as multiple junior anchors, Century Theatres, Dick’s Sporting Goods, and Best Buy. At one time, 24-Hour Fitness was the second-highest paying tenant at the property when it occupied one of the mall’s outparcel buildings, but the tenant vacated prior to its lease expiration in 2022.
CRED iQ’s best comp for the Capital Mall is Kitsap Mall, located 70 miles north in Silverdale, WA. Kitsap Mall was also formerly owned by Starwood Capital Group but became REO in December 2021. The potential future sale of Kitsap Mall will provide meaningful valuation guidance for Capital Mall when it occurs. Kitsap Mall also features a JCPenney and a Macy’s and has an in-line tenant profile that is similar to Capital Mall. For the full valuation report and property-level details, click here.
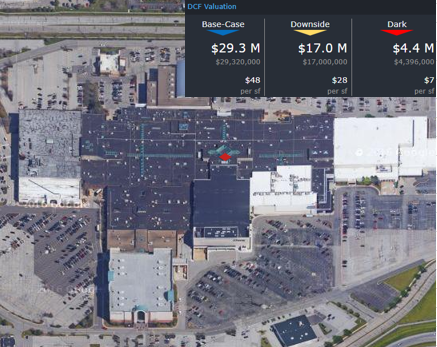
1.2 million sf, Regional Mall, North Olmsted, OH [View Details]
Great Northern Mall is located within the Cleveland, OH MSA in North Olmsted, OH, which is approximately 15 miles outside of Cleveland’s CBD. The total size of the mall is approximately 1.2 million sf; however, only 606,933 sf of the property serves as collateral for the mortgage. The allocated mortgage debt amount for the property is $59.3 million. The property has lost foot traffic, prospective tenants, and overall commerce to nearby Crocker Park, a mixed-use, open-air lifestyle center that possesses the live, work, and play features that are highly sought after in retail developments. Phase 3 of Crocker Park was featured in last week’s WAR Report, which provided a lending landscape analysis for trends in newly originated commercial mortgages.
The Great Northern Mall was appraised for $39.4 million, equal to $65/sf, in November 2021. The updated appraisal value represented a 72% decline compared to the property’s appraisal at loan origination of $141 million, or $232/sf. Of the five properties in the Starwood Mall Portfolio, this property exhibited the greatest decline in value from loan origination through 2021.
Great Northern Mall does not feature any compelling drivers of foot traffic. Traditional anchor boxes include Macy’s, Dillard’s, JCPenney, and a vacant former Sears parcel. None of these buildings serve as collateral for the mortgage loan, although JCPenney pays ground rent. The vacant Sears parcel was sold in 2021 for $7.8 million, equal to $43/sf. Although not a comp in the traditional sense, the transaction provides a reference point for the collateral portion of the Great Northern Mall. For the full valuation report and property-level details, click here.
CRED iQ is a commercial real estate data, analytics, and valuation platform providing actionable intelligence to CRE and capital markets investors. Subscribers to CRED iQ use the platform to identify valuable leads for leasing, lending, refinancing, distressed debt, and acquisition opportunities. Our data platform is powered by over $2.0 trillion of CMBS, CRE CLO, SBLL, Ginnie Mae, FHA/HUD, and Agency loan and property data.
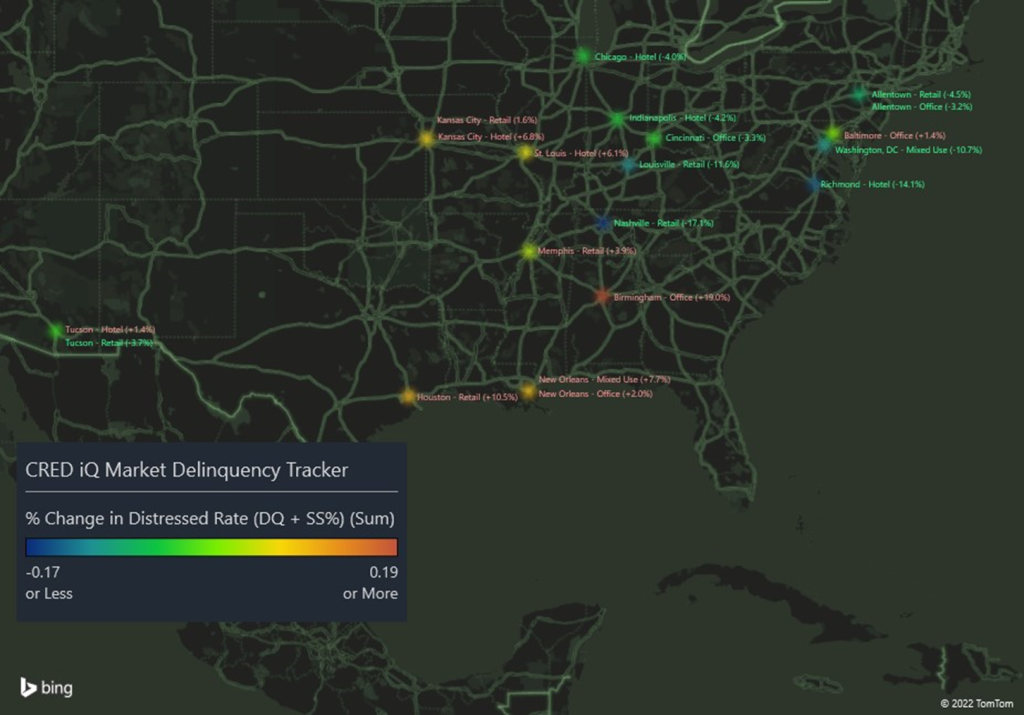
CRED iQ monitors distressed rates (DQ + SS%) and market performance for nearly 400 MSAs across the United States, covering over $900 billion in outstanding CRE debt. Distressed rates and month-over-month changes are presented below, by property type, for the 50 largest markets.
Distressed figures include all properties listed 30 days delinquent or worse, as well as specially serviced loans within the securitized universe including Conduit, Agency, SBLL, and CRE CLO.
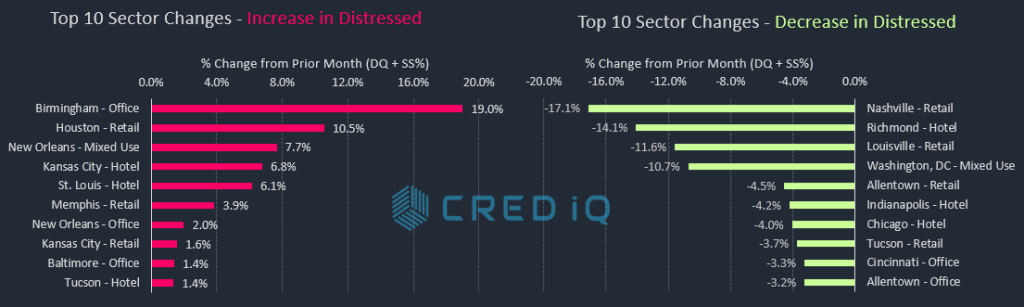
Pockets of distress have materialized across various markets in the office sector over the past month. Birmingham, AL, New Orleans, and Baltimore exhibited the highest increases in office distress, accounting for 3 of the Top 10 increases in distress by market-sector in February 2022. The Birmingham market was impacted by two office properties — Wells Fargo Tower and Inverness Center — transferring to special servicing. The two properties, along with an office building in Columbia, SC, secure a $129.2 million mortgage that is at risk of imminent monetary default, according to the latest servicer commentary.
In addition to office, the retail sector exhibited some volatility, accounting for 3 of the Top 10 increases in distress and three of the Top 10 decreases in distress. The Nashville retail market benefitted from a decline in distress following the cure of CoolSprings Galleria — a 640,176-sf regional mall that secures a $145.6 million mortgage. The loan had transferred to special servicing due to bankruptcy of its sponsor, CBL Properties. CBL Properties was able to complete a restructuring, which then enabled the loan to return to the master servicer. CoolSprings Galleria is one of CBL Properties’ higher quality regional malls.
Another sector with notable improvements in February was the Chicago hotel market. The improvement was primary driven by the delinquency cure of the $95.9 million Marriott Chicago River North Hotel and its subsequent return to the master servicer. The loan had been in special servicing since July 2020 due to pandemic-related issues. Despite the improvement, the rate of distress for Chicago hotels is still one of the highest among the Top 50 MSAs, equal to 43.9% this month.
The distressed rate for the Louisville market improved this month after the $73.6 million Oxmoor Center loan returned to the master servicer as a corrected mortgage. The loan was modified and its maturity date was extended from June 2021 to June 2024. Oxmoor Center is a 941,756-sf regional mall, owned by Brookfield Properties, and features an Apple store as one of its primary drivers of traffic. Anchor boxes include Macy’s, Von Maur, Dick’s Sporting Goods and a vacant former Sears. As a result of this loan’s return to the master servicer, the Louisville market had the greatest month-over-month decline among all rates of distress; however, Louisville still has the second-highest overall distressed rate among the Top 50 MSAs.
The Minneapolis MSA has the highest overall distressed rate at 22.9%, which was slightly lower than the prior month. Louisville (17.9%), New Orleans (13.9%), Cleveland (11.8%), and Milwaukee (10.1%) comprise the remaining markets with the highest rates of distress. The Raleigh market (0.28%) had the lowest percentage of distress among the Top 50 MSAs for the second month in a row. Additionally, Boston (0.91%) exhibited recoveries in delinquency and special servicing to rank as one of the five markets with the lowest amount distress.
New York-Northern New Jersey-Long Island, NY-NJ-PA MSA
$5,921.5
4.8%
-0.6%
New York City – Hotel
$1,576.8
42.6%
0.9%
New York City – Industrial
$07.4
0.4%
-0.1%
New York City – Multifamily
$494.7
1.4%
0.0%
New York City – Office
$1,116.7
2.5%
-0.9%
New York City – Other
$1,280.2
5.5%
-1.0%
New York City – Retail
$1,445.7
10.5%
-0.7%
New York City – Self Storage
$0.0
0.0%
0.0%
Orlando-Kissimmee, FL MSA
$168.7
1.6%
-0.1%
Orlando – Hotel
$79.7
2.8%
-0.4%
Orlando – Industrial
$0.0
0.0%
0.0%
Orlando – Multifamily
$01.9
0.0%
0.0%
Orlando – Office
$47.1
9.7%
0.1%
Orlando – Other
$0.0
0.0%
0.0%
Orlando – Retail
$40.1
4.8%
-1.3%
Orlando – Self Storage
$0.0
0.0%
0.0%
Philadelphia-Camden-Wilmington, PA-NJ-DE-MD MSA
$822.1
4.5%
0.0%
Philadelphia – Hotel
$303.0
33.7%
-0.3%
Philadelphia – Industrial
$0.0
0.0%
0.0%
Philadelphia – Multifamily
$111.3
1.3%
0.1%
Philadelphia – Office
$136.2
3.3%
0.0%
Philadelphia – Other
$47.7
3.5%
-0.1%
Philadelphia – Retail
$223.8
8.8%
-0.5%
Philadelphia – Self Storage
$0.0
0.0%
0.0%
Phoenix-Mesa-Scottsdale, AZ MSA
$251.4
1.4%
0.0%
Phoenix – Hotel
$38.8
2.3%
-0.1%
Phoenix – Industrial
$10.1
3.5%
1.5%
Phoenix – Multifamily
$0.0
0.0%
0.0%
Phoenix – Office
$23.7
1.0%
-0.1%
Phoenix – Other
$15.5
1.8%
-0.3%
Phoenix – Retail
$163.3
7.2%
-0.7%
Phoenix – Self Storage
$0.0
0.0%
0.0%
Pittsburgh, PA MSA
$96.2
2.0%
-0.2%
Pittsburgh – Hotel
$65.1
25.3%
-1.9%
Pittsburgh – Industrial
$0.0
0.0%
0.0%
Pittsburgh – Multifamily
$0.0
0.0%
0.0%
Pittsburgh – Office
$15.3
1.4%
-0.2%
Pittsburgh – Other
$08.0
1.8%
-0.3%
Pittsburgh – Retail
$07.8
1.2%
0.0%
Pittsburgh – Self Storage
$0.0
0.0%
0.0%
Portland-Vancouver-Beaverton, OR-WA MSA
$501.7
7.4%
0.0%
Portland – Hotel
$470.8
54.2%
-0.3%
Portland – Industrial
$0.0
0.0%
0.0%
Portland – Multifamily
$10.2
0.2%
0.0%
Portland – Office
$20.8
5.3%
-0.8%
Portland – Other
$0.0
0.0%
0.0%
Portland – Retail
$0.0
0.0%
0.0%
Portland – Self Storage
$0.0
0.0%
0.0%
Raleigh-Cary, NC MSA
$09.5
0.3%
-0.1%
Raleigh – Hotel
$09.5
3.0%
-0.7%
Raleigh – Industrial
$0.0
0.0%
0.0%
Raleigh – Multifamily
$0.0
0.0%
0.0%
Raleigh – Office
$0.0
0.0%
0.0%
Raleigh – Other
$0.0
0.0%
0.0%
Raleigh – Retail
$0.0
0.0%
0.0%
Raleigh – Self Storage
$0.0
0.0%
0.0%
Richmond, VA MSA
$82.3
2.4%
-1.2%
Richmond – Hotel
$0.0
0.0%
-14.1%
Richmond – Industrial
$0.0
0.0%
0.0%
Richmond – Multifamily
$0.0
0.0%
0.0%
Richmond – Office
$0.0
0.0%
0.0%
Richmond – Other
$0.0
0.0%
0.0%
Richmond – Retail
$82.3
14.6%
-0.8%
Richmond – Self Storage
$0.0
0.0%
0.0%
Riverside-San Bernardino-Ontario, CA MSA
$308.1
3.2%
-0.7%
Riverside – Hotel
$84.2
26.9%
0.9%
Riverside – Industrial
$0.0
0.0%
0.0%
Riverside – Multifamily
$02.4
0.1%
-0.1%
Riverside – Office
$0.0
0.0%
0.0%
Riverside – Other
$0.0
0.0%
0.0%
Riverside – Retail
$221.5
10.6%
-3.0%
Riverside – Self Storage
$0.0
0.0%
0.0%
Sacramento-Arden-Arcade-Roseville, CA MSA
$25.5
0.4%
-0.1%
Sacramento – Hotel
$05.8
1.6%
0.0%
Sacramento – Industrial
$0.0
0.0%
0.0%
Sacramento – Multifamily
$0.0
0.0%
0.0%
Sacramento – Office
$06.1
0.8%
-1.2%
Sacramento – Other
$0.0
0.0%
0.0%
Sacramento – Retail
$13.6
1.7%
0.0%
Sacramento – Self Storage
$0.0
0.0%
0.0%
Salt Lake City, UT MSA
$47.0
1.2%
0.0%
Salt Lake City – Hotel
$47.0
16.3%
-0.3%
Salt Lake City – Industrial
$0.0
0.0%
0.0%
Salt Lake City – Multifamily
$0.0
0.0%
0.0%
Salt Lake City – Office
$0.0
0.0%
0.0%
Salt Lake City – Other
$0.0
0.0%
0.0%
Salt Lake City – Retail
$0.0
0.0%
0.0%
Salt Lake City – Self Storage
$0.0
0.0%
0.0%
San Antonio, TX MSA
$140.9
2.2%
0.0%
San Antonio – Hotel
$08.4
2.5%
0.0%
San Antonio – Industrial
$0.0
0.0%
0.0%
San Antonio – Multifamily
$0.0
0.0%
0.0%
San Antonio – Office
$0.0
0.0%
0.0%
San Antonio – Other
$0.0
0.0%
0.0%
San Antonio – Retail
$131.0
14.3%
-0.7%
San Antonio – Self Storage
$01.5
1.0%
-0.1%
San Diego-Carlsbad-San Marcos, CA MSA
$214.5
1.9%
-0.5%
San Diego – Hotel
$79.2
4.0%
-2.3%
San Diego – Industrial
$0.0
0.0%
0.0%
San Diego – Multifamily
$0.0
0.0%
0.0%
San Diego – Office
$0.0
0.0%
0.0%
San Diego – Other
$20.6
2.9%
-0.4%
San Diego – Retail
$114.8
9.3%
-0.4%
San Diego – Self Storage
$0.0
0.0%
0.0%
San Francisco-Oakland-Fremont, CA MSA
$325.5
1.3%
0.1%
San Francisco – Hotel
$171.7
7.3%
-1.0%
San Francisco – Industrial
$0.0
0.0%
0.0%
San Francisco – Multifamily
$20.0
0.3%
0.0%
San Francisco – Office
$55.6
0.5%
0.4%
San Francisco – Other
$30.6
1.7%
-0.1%
San Francisco – Retail
$47.7
4.1%
0.4%
San Francisco – Self Storage
$0.0
0.0%
0.0%
San Jose-Sunnyvale-Santa Clara, CA MSA
$104.1
0.7%
0.0%
San Jose – Hotel
$89.4
4.3%
-0.2%
San Jose – Industrial
$0.0
0.0%
0.0%
San Jose – Multifamily
$0.0
0.0%
0.0%
San Jose – Office
$14.7
0.2%
0.0%
San Jose – Other
$0.0
0.0%
0.0%
San Jose – Retail
$0.0
0.0%
0.0%
San Jose – Self Storage
$0.0
0.0%
0.0%
Seattle-Tacoma-Bellevue, WA MSA
$109.2
0.6%
0.0%
Seattle – Hotel
$109.2
8.3%
0.6%
Seattle – Industrial
$0.0
0.0%
0.0%
Seattle – Multifamily
$0.0
0.0%
0.0%
Seattle – Office
$0.0
0.0%
0.0%
Seattle – Other
$0.0
0.0%
0.0%
Seattle – Retail
$0.0
0.0%
0.0%
Seattle – Self Storage
$0.0
0.0%
0.0%
St. Louis, MO-IL MSA
$414.6
9.8%
0.4%
St. Louis – Hotel
$58.2
20.7%
6.1%
St. Louis – Industrial
$0.0
0.0%
0.0%
St. Louis – Multifamily
$24.3
1.5%
0.1%
St. Louis – Office
$107.1
19.2%
0.0%
St. Louis – Other
$26.4
4.8%
0.0%
St. Louis – Retail
$198.6
20.0%
-0.4%
St. Louis – Self Storage
$0.0
0.0%
0.0%
Tampa-St. Petersburg-Clearwater, FL
$300.1
3.3%
0.0%
Tampa – Hotel
$30.0
2.6%
-0.1%
Tampa – Industrial
$0.0
0.0%
0.0%
Tampa – Multifamily
$02.6
0.0%
0.0%
Tampa – Office
$23.8
4.0%
-0.2%
Tampa – Other
$0.0
0.0%
0.0%
Tampa – Retail
$243.8
26.9%
0.6%
Tampa – Self Storage
$0.0
0.0%
0.0%
Tucson, AZ MSA
$166.8
5.4%
-0.2%
Tucson – Hotel
$04.7
1.9%
1.4%
Tucson – Industrial
$0.0
0.0%
0.0%
Tucson – Multifamily
$0.0
0.0%
0.0%
Tucson – Office
$0.0
0.0%
0.0%
Tucson – Other
$0.0
0.0%
0.0%
Tucson – Retail
$162.1
20.2%
-3.7%
Tucson – Self Storage
$0.0
0.0%
0.0%
Virginia Beach-Norfolk-Newport News, VA-NC MSA
$211.7
4.7%
-0.2%
Virginia Beach – Hotel
$12.1
2.7%
0.6%
Virginia Beach – Industrial
$21.2
6.7%
-6.7%
Virginia Beach – Multifamily
$0.0
0.0%
0.0%
Virginia Beach – Office
$0.0
0.0%
0.0%
Virginia Beach – Other
$0.0
0.0%
0.0%
Virginia Beach – Retail
$178.4
20.7%
-0.2%
Virginia Beach – Self Storage
$0.0
0.0%
0.0%
Washington-Arlington-Alexandria, DC-VA-MD-WV MSA
$611.3
2.2%
-0.8%
Washington, DC – Hotel
$44.2
4.8%
-0.3%
Washington, DC – Industrial
$11.2
2.0%
0.0%
Washington, DC – Multifamily
$01.3
0.0%
0.0%
Washington, DC – Office
$357.0
5.3%
-0.7%
Washington, DC – Other
$44.7
2.8%
-10.7%
Washington, DC – Retail
$153.0
5.5%
-0.1%
Washington, DC – Self Storage
$0.0
0.0%
0.0%
Grand Total
$25,921.4
3.9%
-0.2%
About CRED iQ
CRED iQ is a commercial real estate data, analytics, and valuation platform providing actionable intelligence to CRE and capital markets investors. Subscribers to CRED iQ use the platform to identify valuable leads for leasing, lending, refinancing, distressed debt, and acquisition opportunities. Our data platform is powered by over $2.0 trillion of CMBS, CRE CLO, SBLL, Ginnie Mae, FHA/HUD, and Freddie Mac loan and property data.
This week, CRED iQ reviewed the commercial real estate lending landscape and highlighted 5 properties that have secured financing in February 2022. The highlighted loan originations cover several property types (retail, mixed use, and multifamily), giving a broad range of financing deals that have been completed across a range of MSAs such as Detroit, Kansas City, Cleveland and Los Angeles.
Using the CRED iQ platform’s Comps functionality, which features propriety Comps scoring for the CRE loan universe, we compared lending terms and loan structures to get a sense of the trends in the CRE lending environment. Additionally, we provided valuations for each asset to evaluate leverage levels in relation to originators’ LTVs. The CRED iQ valuations factor in a base-case (most likely), a downside (significant loss of tenants), and dark scenarios (100% vacant). Base-case valuations for select properties are provided below. For access to the valuation reports as well as full CMBS loan reporting, including detailed financials, updated tenant information, and borrower contact information, sign up for a free trial here.
An $80.4 million loan was originated by Morgan Stanley on February 14, 2022 to refinance existing debt on a power center in Troy, MI, located about 18 miles outside of Detroit. Part of the proceeds from the new origination, totaling approximately $20 million, were used to fund a guarantor reserve due to the absence of a non-recourse carveout guarantor. The guarantor reserve funds may be released after an acceptable guarantor is put into place. The 10-year loan was structured with an interest rate of 4.00% and an initial two-year interest-only period. The loan will be locked out from prepayment for 2 years, and defeasance will be permitted after lockout through the remainder of the loan term until its open period, 5 months prior to maturity.
Using CRED iQ’s Comps functionality, the closest comparable origination was a two-property portfolio loan secured in part by The Forum At Gateways retail center in Sterling Heights, MI. The loan was originated in September 2019 and had an interest rate of 3.94%. The Forum At Gateways is anchored by a Walmart and an LA Fitness. Of note, the comparable loan has been in special servicing since July 2020.
Midtown Square is anchored by Home Depot, Target, Kohl’s, and Kroger. Altogether, the four anchors account for 77% of the property’s NRA. Home Depot and Target have scheduled lease expirations in January 2026 and the Kohl’s lease expires in January 2027. However, all three tenants have several multi-year extension options. The property was 99% occupied as of January 2022 and was appraised at a value of $127.8 million ($220/sf) as of December 2, 2021. The appraisal resulted in an LTV of 63%, and an implied cap rate of 5.58% based on the originator’s underwritten NCF. The debt yield came in at 8.9%, also based on NCF from the originator’s underwriting. For the full valuation report and loan-level details, click here.
Subject Property
Name
Midtown Square
Address
1237 Coolidge Highway Troy, MI 48084
Property Type
Retail
Propety Subtype
Power Center
Building Size
580,251 sf
Year Built
2000
Submarket
Troy South
County
Oakland
MSA
Detroit-Warren-Livonia, MI
Origination Date
2/14/2022
Loan Amount
$80,430,000
Interest Rate
4.00%
Valuation
Appraised Value
$127,800,000 ($220/sf)
Appraisal Date
12/2/2021
Appraisal LTV
62.9%
CRED iQ Base-Case Value
$116,300,000 ($200/sf)
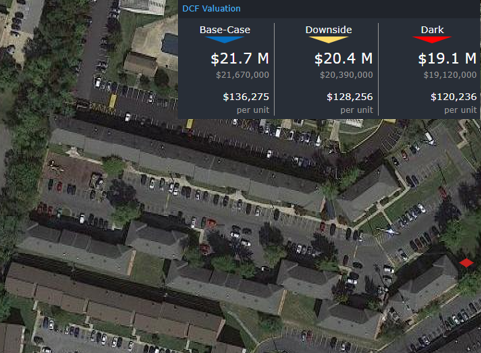
Cimarron Apartments
191 units, Multifamily, Independence, MO
In addition to CMBS, Freddie Mac, and Ginnie Mae, CRED iQ also offers data from loans contributed to Fannie Mae securitizations. Greystone Servicing Company originated a $19.7 million Fannie Mae mortgage on February 7, 2022. The loan was structured with a 12-year term and had an interest rate of 3.96%. The loan has an initial 3-year interest-only period followed by a 30-year amortization schedule. CRED iQ’s highest scoring loan comp was a $6.8 million mortgage secured by Blue Valley Court Townhomes, a 165-unit multifamily property located 2 miles away in Kansas City, MO. The comparable loan was originated in March 2020 and had an interest rate of 3.64%. Cimarron Apartments appraised for $26.5 million, equal to $138,743/unit, as of January 11, 2022, which resulted in an LTV of 74.3% and implied a cap rate of 5.30%. For the full valuation report and loan-level details, click here.
Subject Property
Name
Cimarron Apartments
Address
525 Stone Arch Drive Independence, MO 64052
Property Type
Multifamily
Propety Subtype
Townhome
Building Size
191 units
Year Built
1940
Submarket
East Kansas City
County
Jackson
MSA
Kansas City, MO-KS
Origination Date
2/7/2022
Loan Amount
$19,697,000
Interest Rate
3.96%
Valuation
Appraised Value
$26,5000,000 ($138,743/unit)
Appraisal Date
1/11/2022
Appraisal LTV
74.3%
CRED iQ Base-Case Value
$24,590,000 ($128,757/unit)
Crocker Park (Phase 3)
110,352 sf, Retail, Westlake, OH
Stark Properties secured $19.5 million in mortgage debt from JP Morgan on February 4, 2021 to refinance existing debt on Phase 3 of Crocker Park, an open-air lifestyle center and mixed-use development located in Westlake, OH. The loan is structured with a 10-year term and amortizes over a 30-year schedule. The interest rate is 4.536%, which is comparatively higher than other recent originations secured by retail. The loan will be locked out from prepayment for about 2 years, and defeasance will be permitted after lockout through the remainder of the loan term until its open period, 6 months prior to maturity. Phase One and Phase Two of the Crocker Park development were previously encumbered by a $140 million mortgage that was originated in July 2016 and had an interest rate of 4.92%.
Phase 3 of Crocker Park features a town center layout with ground-floor retail below three to four-story residential components. Only the ground-floor retail components serve as collateral for the recent origination. The largest tenants are H&M (21% of the NRA), Cost Plus World Market (17% of the NRA), and buybuyBaby (13% of the NRA). Cost Plus World Market was formerly a subsidiary of Bed Bath & Beyond while buybuyBaby still is. Both tenants’ leases are scheduled to expire in 2037; however, Bed Bath & Beyond and associated retailers have exhibited willingness to close stores as part of operational efficiency assessments. CRED iQ identified examples of such closures in our January 18, 2022 WAR Report. Credit risk from the property’s primary tenants will be an ongoing concern throughout the loan’s term.
The Phase 3 retail portion of the property was appraised for $31.7 million, equal to $287/sf, as of October 21, 2021, which resulted in an LTV of 61%. The originator’s underwritten net cash flow equated to a debt yield of 9.5% and implied a cap rate of 5.84%. For the full valuation report and loan-level details, click here.
Subject Property
Name
Crocker Park (Phase 3)
Address
177 Market Street Westlake, OH 44145
Property Type
Retail
Propety Subtype
Lifestyle Center
Building Size
110,352 sf
Year Built
2015
Submarket
West
County
Cuyahoga
MSA
Cleveland-Elyria-Mentor OH
Origination Date
2/4/2022
Loan Amount
$19,500,000
Interest Rate
4.54%
Valuation
Appraised Value
$31,700,000 ($287/sf)
Appraisal Date
10/21/2021
Appraisal LTV
61.4%
CRED iQ Base-Case Value
$30,040,000 ($272/sf)
Covina Palms Business Center
71,925-sf, Mixed Use (Medical Office/Retail), West Covina, CA
Bank of America funded an $11.2 million mortgage on February 11, 2022 to refinance existing debt on the Covina Palms Business Center in West Covina, CA. The interest-only loan has a 10-year term and an interest rate of 3.71%. The loan will be locked out from prepayment for 2 years, and then require a yield maintenance charge for prepayment until its open period 5 months prior to maturity in March 2032. Two of CRED iQ’s highest scoring property comps are part of a 14-property Southern California retail portfolio that secures a $214.8 million loan. The portfolio loan secured by the comparable properties, which had an interest-only structure, was originated by Argentic Real Estate Finance in April 2019 and had an interest rate of 4.06%.
The Covina Palms Business Center has the typical layout of a retail community center; however, multiple primary tenants use the space as medical offices. CRED iQ recently provided analysis on the inclusion of mixed-use collateral in CMBS and featured the various combinations of property uses including retail properties with office components such as the Covina Palms Business Center. The largest tenant, 27% of the NRA, operates as a dental practitioner. The property appraised for $22.5 million, equal to $313/sf, as of October 27, 2021, which resulted in an LTV of 50% and implied a cap rate of 5.23% based on the originator’s underwritten net cash flow. The loan also had a debt yield of 10.5% based on the originator’s underwritten net cash flow. For the full valuation report and loan-level details, click here.
Subject Property
Name
Covina Palms Business Center
Address
2211 East Garvey Avenue West Covina, CA 91791
Property Type
Mixed Use
Propety Subtype
Medical Office/Retail
Building Size
71,925 sf
Year Built
1989
Submarket
Covina
County
Los Angeles
MSA
Los Angeles-Long Beach-Santa Ana, CA
Origination Date
2/14/2022
Loan Amount
$11,225,000
Interest Rate
3.71%
Valuation
Appraised Value
$22,500,000 ($313/sf)
Appraisal Date
10/27/2021
Appraisal LTV
49.9%
CRED iQ Base-Case Value
$21,610,000 ($300/sf)
Hampton Inn Texarkana
89 keys, Limited-Service Hotel, Texarkana, AR
A recent example of the lodging sector’s recovery is JP Morgan’s origination of a $5.8 million mortgage on February 3, 2022 to refinance existing debt on a hotel located along the Texas-Arkansas border in Texarkana, AR. The loan has a 10-year term and is structured to amortize on a 30-year schedule. The loan’s interest rate is 5.308% and its maturity date is in March 2032. The hotel’s franchise agreement with Hampton Inn expires in August 2031.
CRED iQ’s comp set for the Hampton Inn Texarkana is the Holiday Inn Express & Suites Texarkana East, which is part of a Starwood Capital Group portfolio of 65 hotels that secure a $577.3 million mortgage. The Hampton Inn is adjacent to the Holiday Inn Express and competes with more than 10 other lodging properties located off the exit of Interstate 30 along the state borders. The property received an appraisal equal to $8.9 million, or $100,000 per key, as of December 1, 2021 based on an expected market value assuming the completion of a property improvement plan. The LTV based on the appraisal assuming the completion of the property improvement plan is 65% with an implied cap rate of 7.65%. For the full valuation report and loan-level details, click here.
Subject Property
Name
Hampton Inn Texarkana
Address
5302 Crossroads Parkway Texarkana, AR 71854
Property Type
Hospitality
Propety Subtype
Limited Service
Building Size
89 keys
Year Built
2013
Submarket
Texarkana
County
Miller
MSA
Texarkana, TX-Texarkana, AR
Origination Date
2/3/2022
Loan Amount
$5,785,000
Interest Rate
5.31%
Valuation
Appraised Value
$8,900,000 ($100,000/key)
Appraisal Date
12/1/2021
Appraisal LTV
65.0%
CRED iQ Base-Case Value
$7,745,000 ($87,027/key)
For full access to our loan database and valuation platform, sign up for a free trial below:
CRED iQ is a commercial real estate data, analytics, and valuation platform providing actionable intelligence to CRE and capital markets investors. Subscribers to CRED iQ use the platform to identify valuable leads for leasing, lending, refinancing, distressed debt, and acquisition opportunities. Our data platform is powered by over $2.0 trillion of CMBS, CRE CLO, SBLL, Ginnie Mae, FHA/HUD, and Agency loan and property data.
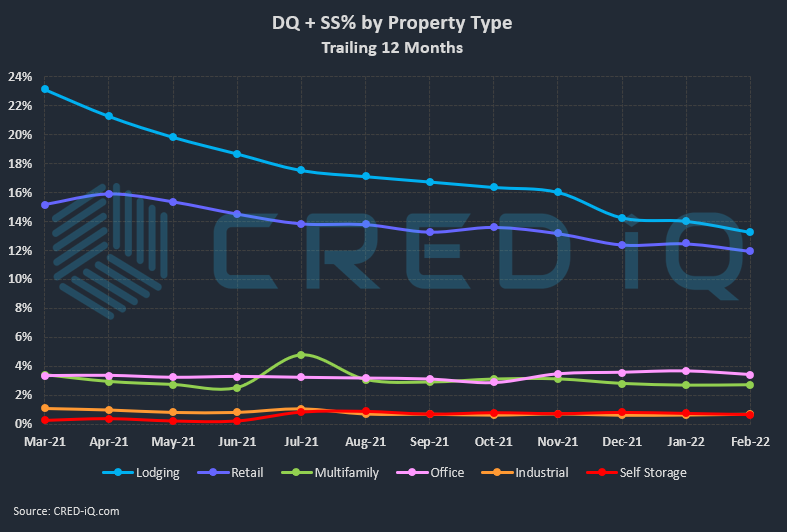
DQ = All delinquent CMBS loans in the conduit and SASB universe, including specially serviced and non-specially serviced loans SS = All specially serviced CMBS loans in the conduit and SASB universe, including current, delinquent and REO DQ + SS = All distressed CMBS loans in the conduit and SASB universe that are delinquent, specially serviced, or a combination of both
The CRED iQ overall delinquency rate for CMBS continued its downward trend this month with a sharp decline, representing the 21st consecutive month-over-month improvement. The delinquency rate, equal to the percentage of all delinquent specially serviced loans and delinquent non-specially serviced loans, for CRED iQ’s sample universe of $500+ billion in CMBS conduit and single-asset single-borrower (SASB) loans was 4.02%, which compares to the prior month’s rate of 4.32%. CRED iQ’s special servicing rate, equal to the percentage of CMBS loans that are with the special servicer (delinquent and non-delinquent), declined month-over-month to 6.43% from 6.91%. The special servicing rate has declined for three consecutive months. Aggregating the two indicators of distress – delinquency rate and special servicing rate – into an overall distressed rate (DQ + SS%) equals 6.60% of CMBS loans that are specially serviced, delinquent, or a combination of both. The overall distressed rate declined compared to the prior month rate of 6.87%. The overall distressed rates typically track slightly higher than special servicing rates as most delinquent loans are also with the special servicer.
DQ = All delinquent CMBS loans in the conduit and SASB universe, including specially serviced and non-specially serviced loans SS = All specially serviced CMBS loans in the conduit and SASB universe, including current, delinquent and REO DQ + SS = All distressed CMBS loans in the conduit and SASB universe that are delinquent, specially serviced, or a combination of both
Individual delinquency rates by property type declined compared to the prior month, except for a nominal increase in delinquent loans secured by industrial properties. Lodging exhibited the highest volume of improvement with nearly $200 million in delinquency cures, loans that have paid current or paid off in full after delinquency in the prior month. The lodging delinquency rate was 8.46%, which compared to 8.95% last month. The retail delinquency rate was 7.41%, a decline from 7.73% in the prior month. The spread between the lodging and retail delinquency rates has narrowed significantly over the trailing 12 months – there was 5.49% variance between lodging and retail delinquency as of February 2021 compared to a 1.05% variance as of the current month. The lodging sector has exhibited a trend of curing delinquencies more expeditiously than retail properties, indicating signs of permanent impairment within the retail sector. A crossover event — where the lodging delinquency rate declines below the retail delinquency rate — is within the range of possibilities over the course of the next year based on the delinquency trends over the past year.
One of the more notable new delinquencies this month was the $425 million Woodlands Mall loan, which is secured by a 758,231-sf regional mall in The Woodlands, TX. Additionally, the $77.1 million Bellis Fair Mall loan, secured by a 538,226-sf regional mall in Bellingham, WA, failed to pay off at maturity. The maturity default was likely anticipated by market constituents given the loan’s debt service coverage ratio (DSCR) of 1.06 based on net cash flow through the first nine months of 2021 coupled with sub-optimal collateral occupancy of 80%.
With the exception of multifamily, special servicing rates declined compared to the prior month across all major property types. Multifamily transfers to special servicing included two properties located in the Permian Basin region of southwest Texas — Aviare Place and University Gardens. The multifamily special servicing rate was 2.55%, which increased compared to 2.49% last month. The lodging sector had the highest special servicing rate (13.19%), which was following by retail (11.47%) and office (3.31%). Although the office special servicing rate tracked lower compared to last month (3.46%), the percentage of office loans in special servicing is still higher than special servicing rates from 6 months and 12 months prior.
DQ + SS = All distressed CMBS loans in the conduit and SASB universe that are delinquent, specially serviced, or a combination of both
CRED iQ’s overall CMBS distressed rate (DQ + SS%) by property type accounts for loans that qualify for either delinquent or special servicing subsets. This month, overall distressed rates for lodging, retail, office, and self storage declined while multifamily and industrial exhibited modest increases in overall distress. Two of the largest loans to transfer to special servicing this month were secured by office properties — the $46.7 million Princeton South Corporate Center loan, secured by 267,426-sf office property in Ewing, NJ, and the $36.6 million 55 Green Street loan, secured by a 54,414-sf office building located in San Francisco’s Financial District. For additional information about these 2 loans, click View Details below:
CRED iQ is a commercial real estate data, analytics, and valuation platform providing actionable intelligence to CRE and capital markets investors. Subscribers to CRED iQ use the platform to identify valuable leads for leasing, lending, refinancing, distressed debt, and acquisition opportunities. Our data platform is powered by over $2.0 trillion of CMBS, CRE CLO, SBLL, and GSE Agency loan and property data.
Loans secured by mixed-use properties accounted for approximately 8% of total conduit issuance in 2021 after nearly reaching 10% in 2020. The mixed-use property type, along with office, helped to offset the decline in securitization volume of hotel and retail properties in 2020 and 2021 vintage CMBS. Although retail collateral accounted for approximately 19% of conduit issuance in 2021, lodging collateral only accounted for about 4%, which was comparatively lower compared to vintage trends from prior years.
The inclusion of mixed-use collateral in CMBS transactions has exhibited a steady, although somewhat erratic, increase in frequency of loans and amount of outstanding debt since 2010. CMBS conduit transactions with a vintage year of 2017 have the highest amount of outstanding debt secured by mixed-use properties with over $4 billion. After a peak in volume in 2017, mixed-use collateral in CMBS conduits declined over 50% in 2018 before rebounding to over $3.7 billion in 2019. There was reduced volume in conduit transactions in 2020 and 2021, compared to 2019, but the concentration of mixed-use properties within collateral pools remained in line with elevated levels over the past 10 years, totaling approximately 9% in 2020 and 8% in 2021.
A property can be classified as mixed-use when revenue from an alternative-use component of the property accounts for a specified percentage of total revenue. The most common type of mixed-use collateral is an office building with a ground floor retail component. With more than 1,700 mixed-use properties in CMBS conduit transactions that CRED iQ monitors, approximately 42% of the properties (47% by outstanding debt) have a retail/office combination of usage. Combinations of multifamily properties with retail components are the next most common property mix type, accounting for 15% of total mixed-use properties (7% by outstanding debt). Office and retail were the most frequent components present in mixed-use CMBS conduit properties.
On a more granular level, many properties are classified as mixed-use within the CMBS reporting package, even though the use type is singular. This is often the case for properties that are part of portfolios that secure a single mortgage. Although these loans are secured by mixed-use portfolios, the individual properties have a singular use. Inclusive of mixed-use portfolios, CRED iQ accounted for over 40 combinations of property uses for mixed-use mortgage collateral. Other types of single use properties that may be categorized as mixed-use include event-driven facilities such as design centers, showrooms, galleries, or other types of event spaces. Even a variety of social clubs have appeared as mixed-use collateral for CMBS loans, although those types of properties have characteristics most in common with retail.
Often times, the physical layout of a building or property with a mixed-use designation belies the true nature of underlying operations. For example, the $2.3 billion GM Building loan is secured by a 2 million-sf 50-story office tower with an iconic retail component at its base — the flagship Apple Store, designer brands DIOR and Balenciaga, and a flagship store for Under Amour (or FAO Schwarz for the nostalgic) are highlights of the GM Building’s retail offerings. Although the retail component of the GM Building is only about 9% of the building’s total NRA, retail tenants accounted for approximately 26% of base rents at loan origination.
The largest mixed-use property by property size and number of uses is McClellan Business Park in Sacramento, CA, which secures a $358 million mortgage. With nearly 7 million square feet, the business park primarily comprises industrial (82% of NRA) and office (15% of NRA), but also features residential and retail buildings as well as airfield hangars.
As different property types fall out of favor or gain popularity from a lending perspective, mixed-use collateral may have an advantage of providing diversification of cash flow from multiple property sectors. Additionally, the physical structure of a mixed-use property may be more amenable to repositioning if one particular use case becomes impaired. Relatively newer mixed-use combinations include life science components, which have distinctive buildouts with attributes of office, lab, and manufacturing characteristics. Nearly all mixed-use properties with a life science component were in a 2019 or later vintage conduit deal. Considering the value-add nature of commercial real estate, properties can evolve to their highest and best use over time, which may require generating cash flow from multiple types of mixed-use combinations. When evaluating mixed-use property types, it is important to ask ‘What’s in your collateral?’
CRED iQ is a commercial real estate data, analytics, and valuation platform designed to unlock investment, financing, and leasing opportunities. CRED iQ provides real-time property, loan, tenant, ownership, and valuation data for over $2.0 trillion of commercial real estate.
This week, CRED iQ calculated real-time valuations for 3 multifamily properties that secure delinquent GNMA loans. Although GNMA loans have mortgage insurance from the FHA as well as a timely payment guarantee, delinquent Ginnie Mae loans can still lead to foreclosure that can provide opportunities for distressed investors looking to step in and inject additional capital or create value-add plans by improving operations. Mortgage originators, distressed investors, and commercial brokers search CRED iQ’s database of approximately 15,000 Ginnie Mae loans totaling more than $138 billion in outstanding debt for their next deal. The properties featured in this week’s WAR Report secure a subset of select Ginnie Mae loans that are at least 30 days delinquent, including 2 properties in the Washington, DC MSA.
CRED iQ valuations factor in a base-case (Most Likely), a downside (significant loss of tenants), and dark scenarios (100% vacant). For full access to the valuation reports as well as full CMBS and GNMA loan reporting, including detailed financials and borrower contact information, sign up for a free trial here.
This $56.1 million loan, which is over 30 days delinquent, is secured by a 4-story, 254-unit multifamily property in Silver Spring, MD, located within walking distance to the Glenmont Station for the Washington Metropolitan Area Transit Authority (WMATA). The mortgage backs Ginnie Mae construction loan certifications (CLCs) and was originated by AGM Financial Services in February 2019. There were 28 funding draws with the latest one occurring in November 2021. The FHA-insured mortgage was issued through the Department of Housing and Urban Development’s (HUD) 221(d)(4) program to facilitate the construction of multifamily properties for moderate-income families. The loan has an interest rate of 4.62%, a 40-year term, and a prepayment premium for the first 10 years of the loan term. The collateral property was renamed as the Atelier Apartments and is part of a 30-acre redevelopment project that also features newly constructed residential townhomes. The property, which opened in 2021, was developed by Buchanan Partners and Elion Partners. Despite the reported delinquency, the property compares favorably to rental stock in the immediate vicinity of Glenmont Station and has superior amenities that should allow the apartments to command rents in line or relatively higher than the market. For the full valuation report and loan-level details, click here.
*Picture of property not available due to new construction.
180 units, Assisted Living, Canton, MI [View Details]
GNMA 2019-3617J4UY3
This $16.3 million loan, which is over 6 months delinquent, is secured by a 180-unit senior housing facility in Canton, MI, located approximately 25 miles west of Detroit, MI. Similar to the Glenmont Metrocenter Apartments, this mortgage represents construction financing that back CLCs. However, this loan was issued through HUD’s 232 program, which facilitates the construction of assisted living facilities. Love Funding originated the loan in April 2019 with an original balance of just under $1 million. Since origination, there have been 19 funding draws with the latest occurring in June 2021. The loan has an interest rate of 4.53% and a maturity date in December 2060. The property was renamed Kingsley Senior Living after completion and provides memory care services as well as assisted living facilities. The facility opened in mid-2021, although the status and velocity of resident enrollment was not disclosed. For the full valuation report and loan-level details, click here.
159 units, Affordable Housing, Temple Hills, MD [View Details]
GNMA 2013-36181GW54
This $8.1 million loan is over 6 months delinquent and is secured by a 3-story, 159-unit affordable housing multifamily property in Temple Hills, MD, located approximately 9 miles outside of Washington, DC. The mortgage backs Ginnie Mae permanent loan certificates (PLCs) and was originated by Wells Fargo Multifamily Capital in September 2013. The loan falls under both Section 221 (d)(4) and Section 223 (a)(7) of FHA’s mortgage insurance program for the rehabilitation and refinancing, respectively, of affordable housing properties. The loan carries an interest rate of 3.85% and has a maturity date in October 2050. A prepayment penalty of 10% is required during the first 5 years of the loan term and then is reduced to 5% before it declines annually by 1%. The loan is eligible for prepayment without penalty on November 1, 2023. The property operates with a Low-Income Housing Tax Credit (LIHTC) and approximately 90% of the units are set aside with rent ceilings lower than 60% of Area Median Income (AMI). The LIHTC was issued in 2003, which is more than 15 years ago, so the property may be out of its initial compliance period. For the full valuation report and loan-level details, click here.
CRED iQ is a commercial real estate data, analytics, and valuation platform providing actionable intelligence to CRE and capital markets investors. Subscribers to CRED iQ use the platform to identify valuable leads for leasing, lending, refinancing, distressed debt, and acquisition opportunities. Our data platform is powered by over $2.0 trillion of CMBS, CRE CLO, SBLL, Ginnie Mae, FHA/HUD, and Agency loan and property data.
Office collateral has been one of the more heavily scrutinized property types in CMBS over the past year given the ever-evolving dynamics of remote work and businesses’ evaluations of the need for physical space. The adverse impacts from the pandemic on lodging and retail were severe and immediate but both sectors recovered substantially over the past 18 months. Conversely, the office sector has been relatively less impacted, and distress has been concentrated to specific sets of factors such as location, class, vintage, or some combination thereof.
CRED iQ’s Distressed Rate for Office CMBS collateral stood at 3.67% as of January 2022 and has increased for 3 consecutive months. The Distressed Rates for Retail and Lodging properties have exhibited a clear downward trend in 2021. That variance in distress among property types can, in part, be attributed to the length of leases for each property type sector. Lodging properties have nightly or weekly rentals and in-line tenants for retail properties generally have lease terms ranging from 2 to 5 years. Lease terms for office properties are typically longer than retail properties and can be 10 years or more in length. Of course, with the uncertainty that a pandemic brings, there has been evidence of pressure for shorter lease terms across retail and office.
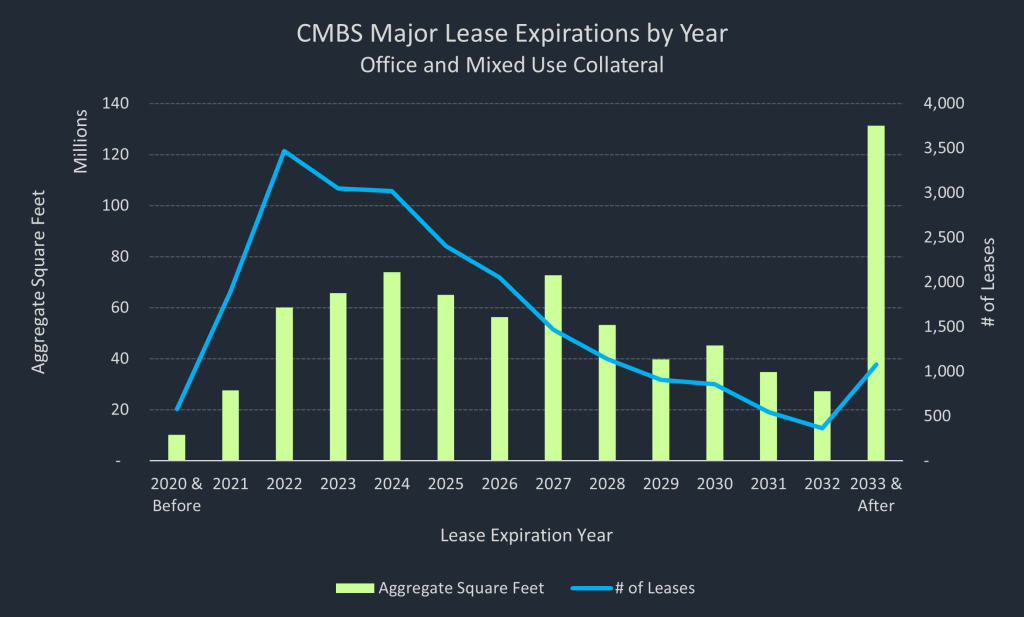
There is generally a longer amount of time required for an office property’s tenant roster to rollover compared to other property types. Examining lease rollover trends is one of many tools we have to identify when and where the next pocket of office distress may materialize. CRED iQ examined over 23,000 major leases in CMBS office and mixed-use collateral properties. For this exercise, all leases that were among the 5 largest by percentage of net rentable area (NRA) for a particular building qualified as a major lease.
Source: CRED-iQ.com
Initial high-level observations included nearly 60 million square feet of office space in CMBS that were set to expire in 2022. The amount of square feet expiring per year ramps up to over 65 million in 2024 and to a peak of almost 74 million square feet in 2024. Lease expirations subsequently taper off in 2025 and 2026 before spiking up in 2027 to approximately 73 million square feet. There are some caveats to these figures — underlying data by its nature is historical, imperfect, and may not reflect the most recent extensions that tenants may have executed. A pertinent example is one of the biggest leases within the subset that is scheduled to expire in 2022 — JP Morgan’s 780,000 square foot lease at 245 Park Avenue in Manhattan, NY. The lease is scheduled to expire in October 2022 but most of the space will not be hitting the market anytime soon because JP Morgan had been subletting to Société Générale. At lease expiration, a direct lease with take effect with the subtenant for a 10-year term with 2, 5-year extension options.
Lease expirations can have several possible outcomes for office landlords. From a positive perspective, a renewal or new direct lease may allow rents to rest higher if market conditions are favorable. However, high vacancies and downward pressures on rental rates may lead to reductions in cash flow and subsequent distressed scenarios.
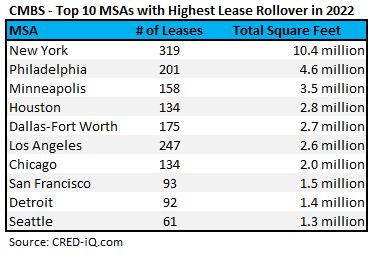
Taking a closer look at lease rollover in 2022, CRED iQ also examined major lease expirations based on geographic concentration. The New York-Northern New-Long Island MSA had the highest number of expiring leases and the most amount of square footage expiring in 2022 with over 300 expiring leases totaling more than 10 million square feet. The Philadelphia MSA had the second highest amount of rollover in 2022 with approximately 4.5 million square feet set to expire in 2022. Minneapolis followed close behind with approximately 3.5 million square feet scheduled to expire in 2022. Other regions that were included in the Top 10 MSAs with Major Lease Expirations included Houston, Dallas, Los Angeles, Chicago, San Francisco, Detroit, and Seattle.
CRED iQ is a commercial real estate data, analytics, and valuation platform providing actionable intelligence to CRE and capital markets investors. Subscribers to CRED iQ use the platform to identify valuable leads for leasing, lending, refinancing, distressed debt, and acquisition opportunities. Our data platform is powered by over $2.0 trillion of CMBS, CRE CLO, SBLL, Ginnie Mae, FHA/HUD, and Agency loan and property data.
This week, CRED iQ calculated real-time valuations for 5 multifamily properties that are REO. REO properties are of particular interest to distressed investors looking for value-add opportunities. After title is taken by a lender, these properties are typically sold within a short time frame or after a period of stabilization. Due to the nature of distress surrounding most REO properties, the assets can often be acquired at a discount relative to stabilized comps. Featured REO assets include a student housing property in Pennsylvania, a senior housing facility in South Carolina, and two garden-style apartment complexes in Texas. To explore a complete list of all multifamily properties in CRED iQ’s platform, click on the link below!
CRED iQ valuations factor in base-case (Most Likely), downside (significant loss of tenants), and dark scenarios (100% vacant). Select valuations are provided for the properties below. For full access to the valuation reports as well as full CMBS loan reporting, including detailed financials, updated tenant information, and borrower contact information, sign up for a free trial here.
University Gate Apartments
485 beds, Student Housing, Erie, PA [View Details]
This property, which has outstanding debt of $18.9 million, has been with the special servicer since July 2019. Title transferred to Torchlight Loan Services, acting as special servicer, in October 2020 via foreclosure. The special servicer sold the property, on behalf of a CMBS securitization, through an auction on ten-x.com in early-December 2021. The property is under contract to sell with an expected price of $13.5 million, equal to $27,753 per bed. The sale was expected to close in February. The sales price provides an updated reference for pricing discovery on distressed student housing properties in the region such as The Depot, which caters to the University of Akron, and Pratt Studios, which caters to the Indiana University of Pennsylvania.
University Gate Apartments primarily serves students attending Penn State Behrend, a satellite campus for Pennsylvania State University located in Erie, PA. The student housing facility initially exhibited occupancy declines in 2018 after Penn State Behrend opened a new on-campus residence building named Trippe Hall. Students’ preference for the new on-campus residence hall led to cash flow issues at University Gate Apartments, which culminated in the property’s receivership and transition to REO. For the full valuation report and loan-level details, click here.
This property, which has outstanding debt of $15.7 million, has been with the special servicer since May 2019. Less than 5 months after its transfer, CWCapital, as special servicer, was able to take title of the property through foreclosure. The property appears to be near the end of a repositioning effort following renovations and upgrades throughout the complex’s units. The renovations have allowed leasing activity at the property to improve and has increased the rental rates at units that have turned over. The apartments were significantly inferior to competing multifamily properties in the Lubbock MSA. Renters’ preferences for newer, higher quality housing options with more amenities was a primary factor that caused occupancy declines at Boston Creek Apartments in 2018 and 2019. Prospective buyers can expect the property to be marketed for sale following a period of stabilization after the completion of renovations. For the full valuation report and loan-level details, click here.
This assisted living and memory care facility, which has an outstanding balance of $8 million, has been with the special servicer since September 2019. In fact, Harbison Shores (fka Agape at Harbison) is the only REO property across all of Freddie Mac’s K-Deals securitizations. The property transferred to CWCapital for special servicing after operational issues and resident attrition caused cash flows to decline. The foreclosure of the property was briefly delayed in early-2020 due to the pandemic, but the facility became REO in June 2020. The pandemic has been a barrier in the property’s path toward stabilization; however, occupancy has recovered to about 91% as of November 2021. The facility has 83 total beds, across 63 units, and most occupants are private-pay residents (approximately 94% of total revenue) with only a handful of Medicaid residents (approximately 4% of total revenue). The properly likely needs additional time for stabilization before it can be sold, which may occur by the end of 2022. For the full valuation report and loan-level details, click here.
This apartment complex, which has an outstanding balance of $3.4 million, has been with the special servicer since October 2020. The loan transferred to KeyBank, acting as special servicer, after the former owner requested an extension related to a forbearance agreement that was granted in May 2020. A forbearance extension did not come to fruition and the former owner attempted to sell the property. A subsequent purchase offer was not sufficient to pay off the outstanding balance plus additional exposure for the mortgage. Without a satisfactory sale, the special servicer pursued foreclosure and the property became REO in July 2021. The property was auctioned in September 2021 but failed to trade. CRED iQ observed a high bid between $63,000 and $66,000 per unit, which failed to meet a pre-determined reserve price. AL thought, the property failed to sell at auction, it will likely be auctioned again in the near term after additional stabilization, which includes management of tenant rollover and improvement of rent collections. Tenant management is an issue that can be traced back to the previous owner and the property’s initial operational struggles that led to it becoming REO. For the full valuation report and loan-level details, click here.
This mid-rise apartment building, which has an outstanding balance of $1.5 million, has been with the special servicer since August 2019. The property’s distress was related to poor property management, which eventually became non-existent after the borrower faced legal troubles. Additionally, the property had issues with insufficient insurance coverage and unauthorized liens. The property became REO in July 2021. The next step is for the property to be sold. Based on the size of the property, it may be sold individually or as a package with other similar or distressed properties in the local market. For the full valuation report and loan-level details, click here.
CRED iQ is a commercial real estate data, analytics, and valuation platform providing actionable intelligence to CRE and capital markets investors. Subscribers to CRED iQ use the platform to identify valuable leads for leasing, lending, refinancing, distressed debt, and acquisition opportunities. Our data platform is powered by over $2.0 trillion of CMBS, CRE CLO, SBLL, Ginnie Mae, FHA/HUD, and Agency loan and property data.
This week, CRED iQ calculated real-time valuations for 5 properties that have major tenants with lease expirations in the next 6 months. Featured leases include central business district (CBD) office space in Manhattan, Baltimore, Los Angeles, and Indianapolis as well as suburban office space in the Detroit MSA. Lease expirations are opportunities for tenant reps to source options and find solutions for clients. Additionally, lease expirations can serve as a preemptive signal of distress for CRE loans if prospects for leasing the newly vacant space are low.
The CRED iQ valuations factor in a base-case (Most Likely), a downside (significant loss of tenants), and dark scenarios (100% vacant). Select valuations are provided for the properties below. For full access to the valuation reports including all 3 valuation scenarios as well as full CMBS loan reporting, with detailed financials, updated tenant information, and borrower contact information, sign up for a free trial here.
Bank of America Plaza
438,996 sf, Suburban Office, Troy, MI [View Details]
Bank of America has a 144,701-sf lease scheduled to expire on July 31, 2022 at an office property located in Troy, MI, approximately 18 miles outside of Detroit. The office building secures a $45.3 million mortgage that is scheduled to mature in September 2024. The impending lease expiration has implications for the upcoming loan maturity. Bank of America’s space accounts for 33% of the property’s NRA and the tenant has 3, 5-year extension options available at lease expiration. However, servicer commentary for the loan indicates the tenant is in negotiations with the borrower regarding extension terms. Additional negotiations may portend a reduced footprint for the tenant if Bank of America no longer has a need for the total space under contract or a lower rental rent if rent steps outlined in the original terms of the 5-year option outpaced market rent for Troy, MI. Considerations for a positive outcome prior to lease expiration include Bank of America’s financial commitment to the building — over $7 million in capital investments — as well as the relative superior class of the property, which was LEED-certified Silver in 2015. For the full valuation report and loan-level details, click here.
58,850 sf, CBD Office, New York, NY [View Details]
TTC USA Consulting has a 27,750-sf lease scheduled to expire on June 30, 2022 at a 10-story office building in the Midtown South submarket of Manhattan, NY. TTC USA Consulting uses the space as a showroom for Turkish Trade Centers. The tenant previously occupied 33,300 sf at the property pursuant to a lease that expired on December 1, 2021. TTC USA Consulting subsequently reduced its footprint by 5,550 sf and signed a short-term lease extension through June 30, 2022. The short-term extension may foreshadow the possibility of TTC USA Consulting’s intention to vacate, especially considering the tenant’s lease had a 5-year extension option available at the previous December 2021 expiration date. Furthermore, the tenant only physically uses the space for showroom events, which have been infrequent throughout the pandemic. Following its downsizing at the building, TTC USA Consulting now accounts for 47% of the property’s NRA. CRED iQ estimates occupancy could decline to 43% should TTC USA Consulting vacate at lease expiration. For the full valuation report and loan-level details, click here.
Laureate Education is vacating 103,335 sf of space at an office condominium in the Harbor East submarket of Baltimore, MD at its lease expiration on June 30, 2022. The office condominium is part of a mixed-use property that includes part of a parking garage and a movie theater. Altogether, the property secures a $25 million mortgage. Laureate Education’s lease was originally scheduled to expire in June 2027, but the for-profit education operator terminated its lease in March 2021. The lease termination required 15 months’ notice, which effectively adjusted the lease expiration to June 2022. Laureate Education leases approximately half of the office condo and its departure will leave the property approximately 33% occupied.
Aside from the 103,335 sf of space that will need to be marketed as available for lease, there is a possibility that additional space in the building will soon hit the market. The property’s second largest tenant, Morgan Stanley Financial Advisors, also has a lease that is set to expire in 2022. Morgan Stanley’s lease accounts for 19% of the office condo’s NRA but the tenant has 2, 5-year extension options. Baltimore has had its fair share of struggles with office vacancy — CRED iQ’s January 10, 2021 WAR Report discusses office tenants’ location preferences for the Harbor Point submarket over the Inner Harbor/CBD submarkets. Positive attributes for the soon-to-be vacant office space are its close proximity to Harbor Point and relatively newer build compared to similar office properties in the market. For the full valuation report and loan-level details, click here.
106,875 sf, Office, Los Angeles, CA [View Details]
Two tenants have upcoming lease expirations in April and May at an office building in West Los Angeles. Lot 5 Media has a 45,158-sf lease, accounting for 42% of NRA, that is scheduled to expire on May 31, 2022. Lot 5 Media uses the space for post-production media services including turn-key offices outfitted with various media and production amenities. Kung Fu Factory, a video game developer, has a 14,882-sf lease, accounting for 14% of the GLA, that expires on April 30, 2022. Both tenants have been in occupancy for more than 5 years. Furthermore, Lot 5 Media has signage on the building and appears to have invested heavily in customizing its space for client offerings. The office building secures a $35.5 million mortgage that matures in January 2026. The property is fairly unique within its neighborhood, which comprises primarily residential housing. Should either Lot 5 Media or Kung Fu Factory vacate, prospective medical office tenants may find amenities at the property appealing. Several smaller suites at the property are used as medical offices and the building has a parking garage for efficient ingress and egress. For the full valuation report and loan-level details, click here.
48,702 sf, Mixed Use (Office/Retail), Indianapolis, IN [View Details]
Hensley Legal Group, a local law firm, has a 15,882-sf lease that is scheduled to expire on March 31, 2022 at an office building in CBD Indianapolis. The lease accounts for 33% of the building’s NRA. Hensley Legal Group is one of 3 tenants at the property, which secures a $6.2 million mortgage. The largest tenant, which accounts for 40% of the property’s NRA, is an affiliate of the loan sponsor and the smallest tenant, Fogo de Chão, operates a restaurant on the ground floor of the building. Servicer commentary for the loan has not yet confirmed if Henley Legal Group plans to renew or vacate. Should the tenant vacate, the sponsor-affiliated tenant may be a candidate expand into some of the vacant space. Otherwise, occupancy at the property may decline to 77%. For the full valuation report and loan-level details, click here.
CRED iQ is a commercial real estate data, analytics, and valuation platform providing actionable intelligence to CRE and capital markets investors. Subscribers to CRED iQ use the platform to identify valuable leads for leasing, lending, refinancing, distressed debt, and acquisition opportunities. Our data platform is powered by over $2.0 trillion of CMBS, CRE CLO, SBLL, and GSE Agency loan and property data.