
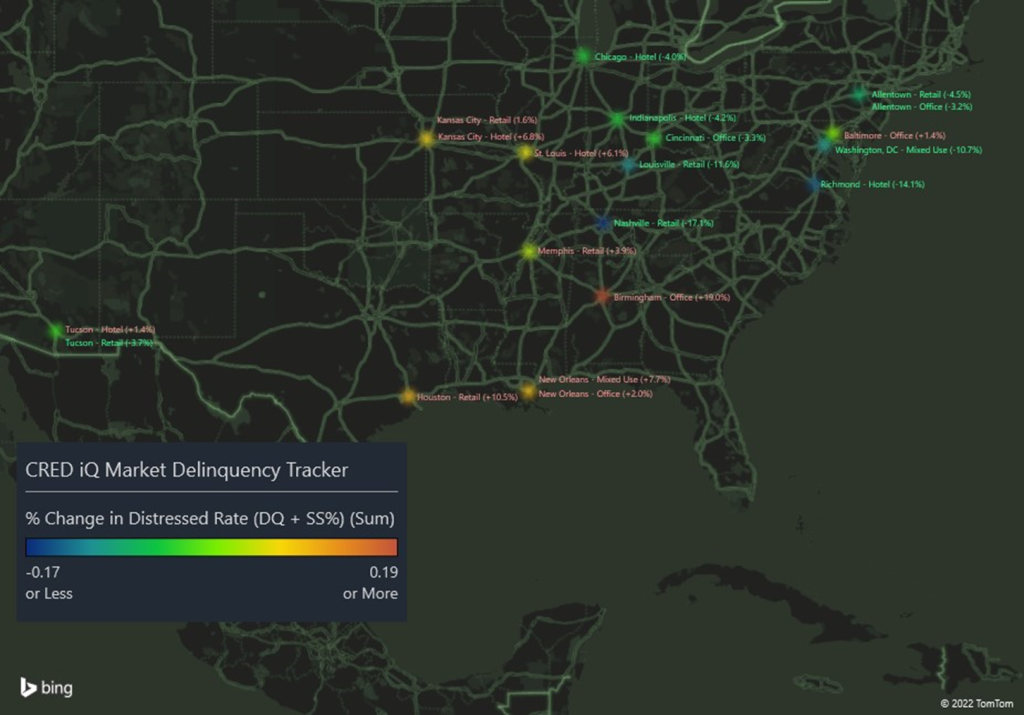
CRED iQ monitors distressed rates (DQ + SS%) and market performance for nearly 400 MSAs across the United States, covering over $900 billion in outstanding CRE debt. Distressed rates and month-over-month changes are presented below, by property type, for the 50 largest markets.
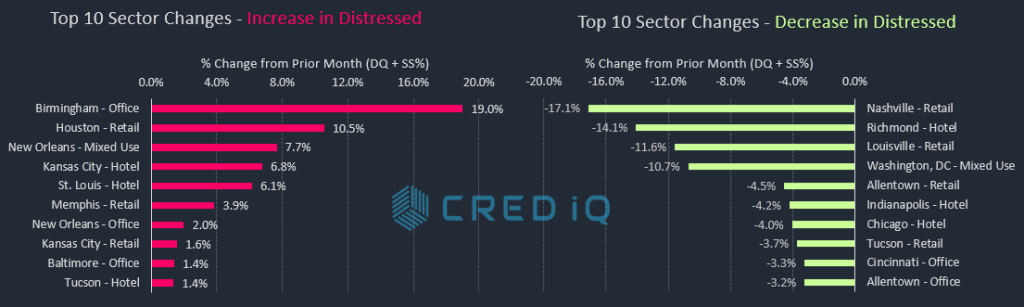
Pockets of distress have materialized across various markets in the office sector over the past month. Birmingham, AL, New Orleans, and Baltimore exhibited the highest increases in office distress, accounting for 3 of the Top 10 increases in distress by market-sector in February 2022. The Birmingham market was impacted by two office properties — Wells Fargo Tower and Inverness Center — transferring to special servicing. The two properties, along with an office building in Columbia, SC, secure a $129.2 million mortgage that is at risk of imminent monetary default, according to the latest servicer commentary.
In addition to office, the retail sector exhibited some volatility, accounting for 3 of the Top 10 increases in distress and three of the Top 10 decreases in distress. The Nashville retail market benefitted from a decline in distress following the cure of CoolSprings Galleria — a 640,176-sf regional mall that secures a $145.6 million mortgage. The loan had transferred to special servicing due to bankruptcy of its sponsor, CBL Properties. CBL Properties was able to complete a restructuring, which then enabled the loan to return to the master servicer. CoolSprings Galleria is one of CBL Properties’ higher quality regional malls.
Another sector with notable improvements in February was the Chicago hotel market. The improvement was primary driven by the delinquency cure of the $95.9 million Marriott Chicago River North Hotel and its subsequent return to the master servicer. The loan had been in special servicing since July 2020 due to pandemic-related issues. Despite the improvement, the rate of distress for Chicago hotels is still one of the highest among the Top 50 MSAs, equal to 43.9% this month.
The distressed rate for the Louisville market improved this month after the $73.6 million Oxmoor Center loan returned to the master servicer as a corrected mortgage. The loan was modified and its maturity date was extended from June 2021 to June 2024. Oxmoor Center is a 941,756-sf regional mall, owned by Brookfield Properties, and features an Apple store as one of its primary drivers of traffic. Anchor boxes include Macy’s, Von Maur, Dick’s Sporting Goods and a vacant former Sears. As a result of this loan’s return to the master servicer, the Louisville market had the greatest month-over-month decline among all rates of distress; however, Louisville still has the second-highest overall distressed rate among the Top 50 MSAs.
The Minneapolis MSA has the highest overall distressed rate at 22.9%, which was slightly lower than the prior month. Louisville (17.9%), New Orleans (13.9%), Cleveland (11.8%), and Milwaukee (10.1%) comprise the remaining markets with the highest rates of distress. The Raleigh market (0.28%) had the lowest percentage of distress among the Top 50 MSAs for the second month in a row. Additionally, Boston (0.91%) exhibited recoveries in delinquency and special servicing to rank as one of the five markets with the lowest amount distress.
For the full CRED DQ Report, download here:
| MSA – Property Type | DQ/SS (millions) | DS/SS (%) | Monthly Change |
| Allentown-Bethlehem-Easton, PA-NJ MSA | $78.6 | 2.5% | -0.4% |
| Allentown – Hotel | $0.0 | 0.0% | 0.0% |
| Allentown – Industrial | $0.0 | 0.0% | 0.0% |
| Allentown – Multifamily | $0.0 | 0.0% | 0.0% |
| Allentown – Office | $59.3 | 17.7% | -3.2% |
| Allentown – Other | $0.0 | 0.0% | 0.0% |
| Allentown – Retail | $19.3 | 5.2% | -4.5% |
| Allentown – Self Storage | $0.0 | 0.0% | 0.0% |
| Atlanta-Sandy Springs-Marietta, GA MSA | $751.5 | 2.9% | -0.1% |
| Atlanta – Hotel | $213.4 | 11.5% | 0.2% |
| Atlanta – Industrial | $18.0 | 3.1% | 1.3% |
| Atlanta – Multifamily | $03.0 | 0.0% | 0.0% |
| Atlanta – Office | $07.6 | 0.2% | 0.0% |
| Atlanta – Other | $0.0 | 0.0% | 0.0% |
| Atlanta – Retail | $509.5 | 19.2% | -1.2% |
| Atlanta – Self Storage | $0.0 | 0.0% | 0.0% |
| Austin-Round Rock, TX MSA | $198.0 | 2.2% | 0.1% |
| Austin – Hotel | $51.8 | 6.1% | -0.8% |
| Austin – Industrial | $0.0 | 0.0% | 0.0% |
| Austin – Multifamily | $57.7 | 1.0% | 0.4% |
| Austin – Office | $0.0 | 0.0% | 0.0% |
| Austin – Other | $0.0 | 0.0% | 0.0% |
| Austin – Retail | $85.9 | 9.1% | -2.4% |
| Austin – Self Storage | $02.6 | 2.9% | 0.0% |
| Baltimore-Towson, MD MSA | $418.1 | 4.4% | 0.1% |
| Baltimore – Hotel | $111.2 | 25.2% | -0.1% |
| Baltimore – Industrial | $0.0 | 0.0% | 0.0% |
| Baltimore – Multifamily | $06.1 | 0.1% | 0.0% |
| Baltimore – Office | $33.4 | 5.3% | 1.4% |
| Baltimore – Other | $11.8 | 3.2% | 0.0% |
| Baltimore – Retail | $255.7 | 22.5% | -1.2% |
| Baltimore – Self Storage | $0.0 | 0.0% | 0.0% |
| Birmingham – Birmingham-Hoover, AL MSA | $159.1 | 5.8% | 3.2% |
| Birmingham – Hotel | $39.7 | 38.3% | -0.2% |
| Birmingham – Industrial | $0.0 | 0.0% | 0.0% |
| Birmingham – Multifamily | $0.0 | 0.0% | 0.0% |
| Birmingham – Office | $96.6 | 19.0% | 19.0% |
| Birmingham – Other | $0.0 | 0.0% | 0.0% |
| Birmingham – Retail | $22.8 | 3.1% | -0.1% |
| Birmingham – Self Storage | $0.0 | 0.0% | 0.0% |
| Boston – Boston-Cambridge-Quincy, MA-NH MSA | $157.5 | 0.9% | -0.1% |
| Boston – Hotel | $45.3 | 6.5% | -0.2% |
| Boston – Industrial | $0.0 | 0.0% | 0.0% |
| Boston – Multifamily | $0.0 | 0.0% | -0.2% |
| Boston – Office | $0.0 | 0.0% | 0.0% |
| Boston – Other | $0.0 | 0.0% | 0.0% |
| Boston – Retail | $112.2 | 5.7% | -0.5% |
| Boston – Self Storage | $0.0 | 0.0% | 0.0% |
| Bridgeport – Bridgeport-Stamford-Norwalk, CT MSA | $221.3 | 5.6% | -0.2% |
| Bridgeport – Hotel | $62.6 | 51.0% | -0.1% |
| Bridgeport – Industrial | $17.8 | 15.0% | 0.9% |
| Bridgeport – Multifamily | $0.9 | 0.1% | -0.1% |
| Bridgeport – Office | $108.3 | 8.5% | -1.5% |
| Bridgeport – Other | $09.8 | 2.4% | 0.0% |
| Bridgeport – Retail | $21.7 | 6.7% | -0.5% |
| Bridgeport – Self Storage | $0.0 | 0.0% | 0.0% |
| Charlotte – Charlotte-Gastonia-Concord, NC-SC MSA | $285.5 | 3.6% | 0.0% |
| Charlotte – Hotel | $87.6 | 7.4% | 0.0% |
| Charlotte – Industrial | $0.0 | 0.0% | 0.0% |
| Charlotte – Multifamily | $0.7 | 0.0% | 0.0% |
| Charlotte – Office | $21.3 | 2.3% | 0.0% |
| Charlotte – Other | $85.0 | 26.8% | 1.5% |
| Charlotte – Retail | $90.9 | 7.8% | -0.4% |
| Charlotte – Self Storage | $0.0 | 0.0% | 0.0% |
| Chicago – Chicago-Naperville-Joliet, IL-IN-WI MSA | $2,338.5 | 8.8% | -0.5% |
| Chicago – Hotel | $920.1 | 43.9% | -4.0% |
| Chicago – Industrial | $03.8 | 0.2% | 0.0% |
| Chicago – Multifamily | $121.9 | 1.3% | 0.0% |
| Chicago – Office | $773.4 | 10.0% | -0.7% |
| Chicago – Other | $256.1 | 13.4% | 0.7% |
| Chicago – Retail | $263.2 | 7.8% | -0.4% |
| Chicago – Self Storage | $0.0 | 0.0% | 0.0% |
| Cincinnati – Cincinnati-Middletown, OH-KY-IN MSA | $277.8 | 7.2% | -0.7% |
| Cincinnati – Hotel | $126.5 | 41.8% | -0.5% |
| Cincinnati – Industrial | $0.0 | 0.0% | 0.0% |
| Cincinnati – Multifamily | $0.0 | 0.0% | 0.0% |
| Cincinnati – Office | $0.0 | 0.0% | -3.3% |
| Cincinnati – Other | $15.6 | 5.3% | 0.0% |
| Cincinnati – Retail | $134.6 | 19.7% | -2.7% |
| Cincinnati – Self Storage | $01.0 | 1.7% | -0.2% |
| Cleveland – Cleveland-Elyria-Mentor, OH MSA | $468.4 | 11.7% | -0.5% |
| Cleveland – Hotel | $97.1 | 49.8% | -2.3% |
| Cleveland – Industrial | $0.0 | 0.0% | 0.0% |
| Cleveland – Multifamily | $03.3 | 0.2% | -0.3% |
| Cleveland – Office | $104.3 | 12.8% | -0.3% |
| Cleveland – Other | $176.3 | 40.5% | -2.4% |
| Cleveland – Retail | $87.4 | 12.4% | -0.4% |
| Cleveland – Self Storage | $0.0 | 0.0% | 0.0% |
| Columbus, OH – Columbus, OH MSA | $240.2 | 3.7% | -0.4% |
| Columbus, OH – Hotel | $83.6 | 27.0% | 0.3% |
| Columbus, OH – Industrial | $11.9 | 3.2% | -0.2% |
| Columbus, OH – Multifamily | $0.0 | 0.0% | -0.1% |
| Columbus, OH – Office | $12.4 | 2.1% | -0.3% |
| Columbus, OH – Other | $0.0 | 0.0% | 0.0% |
| Columbus, OH – Retail | $121.4 | 14.8% | -0.2% |
| Columbus, OH – Self Storage | $11.0 | 18.0% | -1.0% |
| Dallas-Fort Worth-Arlington, TX MSA | $545.2 | 1.7% | -0.2% |
| Dallas – Hotel | $239.5 | 6.8% | 0.1% |
| Dallas – Industrial | $01.7 | 0.1% | 0.0% |
| Dallas – Multifamily | $05.2 | 0.0% | -0.2% |
| Dallas – Office | $102.8 | 2.8% | -1.4% |
| Dallas – Other | $23.6 | 1.1% | 0.0% |
| Dallas – Retail | $160.5 | 6.6% | -0.3% |
| Dallas – Self Storage | $11.9 | 3.2% | -0.2% |
| Denver-Aurora, CO MSA | $344.6 | 2.1% | 0.0% |
| Denver – Hotel | $36.0 | 4.2% | 0.0% |
| Denver – Industrial | $0.0 | 0.0% | 0.0% |
| Denver – Multifamily | $0.7 | 0.0% | 0.0% |
| Denver – Office | $183.3 | 9.2% | -0.5% |
| Denver – Other | $66.5 | 7.0% | -0.1% |
| Denver – Retail | $54.8 | 3.8% | -0.1% |
| Denver – Self Storage | $03.3 | 1.9% | -0.1% |
| Detroit-Warren-Livonia, MI MSA | $490.1 | 5.3% | 0.1% |
| Detroit – Hotel | $213.9 | 30.2% | -0.9% |
| Detroit – Industrial | $18.5 | 3.3% | -0.2% |
| Detroit – Multifamily | $33.6 | 0.9% | 0.1% |
| Detroit – Office | $0.0 | 0.0% | 0.0% |
| Detroit – Other | $22.2 | 3.6% | -0.1% |
| Detroit – Retail | $201.9 | 11.7% | 1.2% |
| Detroit – Self Storage | $0.0 | 0.0% | 0.0% |
| Hartford-West Hartford-East Hartford, CT MSA | $199.6 | 8.1% | 0.2% |
| Hartford – Hotel | $75.4 | 55.2% | -0.6% |
| Hartford – Industrial | $0.0 | 0.0% | 0.0% |
| Hartford – Multifamily | $06.5 | 0.5% | 0.5% |
| Hartford – Office | $87.6 | 22.0% | -0.3% |
| Hartford – Other | $0.0 | 0.0% | 0.0% |
| Hartford – Retail | $30.1 | 12.8% | -0.3% |
| Hartford – Self Storage | $0.0 | 0.0% | 0.0% |
| Houston-Sugar Land-Baytown, TX MSA | $1,678.0 | 7.0% | 1.6% |
| Houston – Hotel | $590.5 | 49.7% | -2.9% |
| Houston – Industrial | $04.2 | 0.8% | -0.1% |
| Houston – Multifamily | $28.9 | 0.2% | -0.1% |
| Houston – Office | $490.7 | 12.0% | -0.5% |
| Houston – Other | $0.0 | 0.0% | 0.0% |
| Houston – Retail | $533.8 | 13.4% | 10.5% |
| Houston – Self Storage | $29.9 | 7.6% | -0.5% |
| Indianapolis-Carmel, IN MSA | $283.3 | 5.2% | -0.8% |
| Indianapolis – Hotel | $81.9 | 13.4% | -4.2% |
| Indianapolis – Industrial | $0.0 | 0.0% | 0.0% |
| Indianapolis – Multifamily | $74.5 | 2.7% | -0.5% |
| Indianapolis – Office | $75.3 | 12.3% | -0.5% |
| Indianapolis – Other | $09.7 | 2.9% | 0.1% |
| Indianapolis – Retail | $37.8 | 7.3% | -0.1% |
| Indianapolis – Self Storage | $04.0 | 5.9% | 0.5% |
| Jacksonville, FL MSA | $54.9 | 1.0% | 0.0% |
| Jacksonville – Hotel | $38.4 | 9.1% | -0.3% |
| Jacksonville – Industrial | $0.0 | 0.0% | 0.0% |
| Jacksonville – Multifamily | $04.9 | 0.1% | 0.1% |
| Jacksonville – Office | $0.0 | 0.0% | 0.0% |
| Jacksonville – Other | $0.0 | 0.0% | 0.0% |
| Jacksonville – Retail | $11.5 | 2.6% | -0.2% |
| Jacksonville – Self Storage | $0.0 | 0.0% | 0.0% |
| Kansas City, MO-KS MSA | $115.5 | 2.3% | 0.6% |
| Kansas City – Hotel | $50.2 | 18.7% | 6.8% |
| Kansas City – Industrial | $0.0 | 0.0% | 0.0% |
| Kansas City – Multifamily | $07.5 | 0.3% | -0.2% |
| Kansas City – Office | $0.0 | 0.0% | 0.0% |
| Kansas City – Other | $02.8 | 1.2% | 0.0% |
| Kansas City – Retail | $53.3 | 7.5% | 1.6% |
| Kansas City – Self Storage | $01.7 | 0.8% | 0.0% |
| Las Vegas-Paradise, NV MSA | $350.1 | 1.8% | 0.0% |
| Las Vegas – Hotel | $18.3 | 0.3% | 0.0% |
| Las Vegas – Industrial | $0.0 | 0.0% | 0.0% |
| Las Vegas – Multifamily | $0.0 | 0.0% | 0.0% |
| Las Vegas – Office | $21.8 | 3.2% | -1.2% |
| Las Vegas – Other | $0.0 | 0.0% | 0.0% |
| Las Vegas – Retail | $307.3 | 6.4% | -0.1% |
| Las Vegas – Self Storage | $02.8 | 1.4% | -0.1% |
| Los Angeles-Long Beach-Santa Ana, CA MSA | $1,266.1 | 2.5% | -0.1% |
| Los Angeles – Hotel | $460.6 | 9.9% | -2.3% |
| Los Angeles – Industrial | $02.0 | 0.2% | 0.0% |
| Los Angeles – Multifamily | $129.4 | 0.6% | 0.0% |
| Los Angeles – Office | $73.7 | 0.6% | 0.0% |
| Los Angeles – Other | $72.0 | 2.3% | -0.1% |
| Los Angeles – Retail | $528.3 | 7.8% | -0.2% |
| Los Angeles – Self Storage | $0.0 | 0.0% | 0.0% |
| Louisville/Jefferson County, KY-IN MSA | $549.4 | 17.9% | -3.3% |
| Louisville – Hotel | $242.9 | 54.7% | -0.7% |
| Louisville – Industrial | $0.0 | 0.0% | 0.0% |
| Louisville – Multifamily | $03.8 | 0.3% | -0.1% |
| Louisville – Office | $0.0 | 0.0% | 0.0% |
| Louisville – Other | $0.0 | 0.0% | 0.0% |
| Louisville – Retail | $302.8 | 47.5% | -11.6% |
| Louisville – Self Storage | $0.0 | 0.0% | 0.0% |
| Memphis, TN-AR-MS MSA | $140.5 | 6.1% | 0.7% |
| Memphis – Hotel | $40.7 | 22.6% | -0.7% |
| Memphis – Industrial | $0.0 | 0.0% | 0.0% |
| Memphis – Multifamily | $17.8 | 1.6% | 0.0% |
| Memphis – Office | $0.0 | 0.0% | 0.0% |
| Memphis – Other | $18.4 | 27.9% | 3.4% |
| Memphis – Retail | $62.0 | 16.2% | 3.9% |
| Memphis – Self Storage | $01.7 | 1.2% | 0.0% |
| Miami-Fort Lauderdale-Pompano Beach, FL MSA | $623.0 | 2.7% | -0.5% |
| Miami – Hotel | $231.5 | 5.2% | -1.1% |
| Miami – Industrial | $0.0 | 0.0% | 0.0% |
| Miami – Multifamily | $04.4 | 0.1% | -0.1% |
| Miami – Office | $07.6 | 0.4% | 0.0% |
| Miami – Other | $08.6 | 0.5% | 0.0% |
| Miami – Retail | $370.9 | 6.7% | -1.4% |
| Miami – Self Storage | $0.0 | 0.0% | 0.0% |
| Milwaukee-Waukesha-West Allis, WI MSA | $246.1 | 10.1% | -0.6% |
| Milwaukee – Hotel | $35.4 | 23.7% | 0.7% |
| Milwaukee – Industrial | $0.0 | 0.0% | 0.0% |
| Milwaukee – Multifamily | $0.0 | 0.0% | 0.0% |
| Milwaukee – Office | $59.2 | 11.8% | 0.0% |
| Milwaukee – Other | $0.0 | 0.0% | 0.0% |
| Milwaukee – Retail | $151.5 | 29.1% | -2.0% |
| Milwaukee – Self Storage | $0.0 | 0.0% | 0.0% |
| Minneapolis-St. Paul-Bloomington, MN-WI MSA | $1,892.3 | 22.9% | -0.2% |
| Minneapolis – Hotel | $308.4 | 50.7% | -0.3% |
| Minneapolis – Industrial | $0.0 | 0.0% | 0.0% |
| Minneapolis – Multifamily | $0.0 | 0.0% | 0.0% |
| Minneapolis – Office | $140.5 | 6.9% | -0.6% |
| Minneapolis – Other | $11.6 | 2.8% | 0.2% |
| Minneapolis – Retail | $1,431.8 | 73.3% | -1.8% |
| Minneapolis – Self Storage | $0.0 | 0.0% | 0.0% |
| Nashville-Davidson-Murfreesboro-Franklin, TN MSA | $248.1 | 3.9% | -2.2% |
| Nashville – Hotel | $238.6 | 16.6% | -1.7% |
| Nashville – Industrial | $0.0 | 0.0% | 0.0% |
| Nashville – Multifamily | $0.0 | 0.0% | 0.0% |
| Nashville – Office | $0.0 | 0.0% | 0.0% |
| Nashville – Other | $0.0 | 0.0% | 0.0% |
| Nashville – Retail | $09.5 | 1.2% | -17.1% |
| Nashville – Self Storage | $0.0 | 0.0% | 0.0% |
| New Orleans-Metairie-Kenner, LA MSA | $467.6 | 13.9% | -0.9% |
| New Orleans – Hotel | $388.4 | 38.1% | -3.2% |
| New Orleans – Industrial | $0.0 | 0.0% | 0.0% |
| New Orleans – Multifamily | $13.9 | 1.7% | 0.0% |
| New Orleans – Office | $27.5 | 5.6% | 2.0% |
| New Orleans – Other | $15.3 | 7.9% | 7.7% |
| New Orleans – Retail | $22.6 | 3.2% | 0.0% |
| New Orleans – Self Storage | $0.0 | 0.0% | 0.0% |
| New York-Northern New Jersey-Long Island, NY-NJ-PA MSA | $5,921.5 | 4.8% | -0.6% |
| New York City – Hotel | $1,576.8 | 42.6% | 0.9% |
| New York City – Industrial | $07.4 | 0.4% | -0.1% |
| New York City – Multifamily | $494.7 | 1.4% | 0.0% |
| New York City – Office | $1,116.7 | 2.5% | -0.9% |
| New York City – Other | $1,280.2 | 5.5% | -1.0% |
| New York City – Retail | $1,445.7 | 10.5% | -0.7% |
| New York City – Self Storage | $0.0 | 0.0% | 0.0% |
| Orlando-Kissimmee, FL MSA | $168.7 | 1.6% | -0.1% |
| Orlando – Hotel | $79.7 | 2.8% | -0.4% |
| Orlando – Industrial | $0.0 | 0.0% | 0.0% |
| Orlando – Multifamily | $01.9 | 0.0% | 0.0% |
| Orlando – Office | $47.1 | 9.7% | 0.1% |
| Orlando – Other | $0.0 | 0.0% | 0.0% |
| Orlando – Retail | $40.1 | 4.8% | -1.3% |
| Orlando – Self Storage | $0.0 | 0.0% | 0.0% |
| Philadelphia-Camden-Wilmington, PA-NJ-DE-MD MSA | $822.1 | 4.5% | 0.0% |
| Philadelphia – Hotel | $303.0 | 33.7% | -0.3% |
| Philadelphia – Industrial | $0.0 | 0.0% | 0.0% |
| Philadelphia – Multifamily | $111.3 | 1.3% | 0.1% |
| Philadelphia – Office | $136.2 | 3.3% | 0.0% |
| Philadelphia – Other | $47.7 | 3.5% | -0.1% |
| Philadelphia – Retail | $223.8 | 8.8% | -0.5% |
| Philadelphia – Self Storage | $0.0 | 0.0% | 0.0% |
| Phoenix-Mesa-Scottsdale, AZ MSA | $251.4 | 1.4% | 0.0% |
| Phoenix – Hotel | $38.8 | 2.3% | -0.1% |
| Phoenix – Industrial | $10.1 | 3.5% | 1.5% |
| Phoenix – Multifamily | $0.0 | 0.0% | 0.0% |
| Phoenix – Office | $23.7 | 1.0% | -0.1% |
| Phoenix – Other | $15.5 | 1.8% | -0.3% |
| Phoenix – Retail | $163.3 | 7.2% | -0.7% |
| Phoenix – Self Storage | $0.0 | 0.0% | 0.0% |
| Pittsburgh, PA MSA | $96.2 | 2.0% | -0.2% |
| Pittsburgh – Hotel | $65.1 | 25.3% | -1.9% |
| Pittsburgh – Industrial | $0.0 | 0.0% | 0.0% |
| Pittsburgh – Multifamily | $0.0 | 0.0% | 0.0% |
| Pittsburgh – Office | $15.3 | 1.4% | -0.2% |
| Pittsburgh – Other | $08.0 | 1.8% | -0.3% |
| Pittsburgh – Retail | $07.8 | 1.2% | 0.0% |
| Pittsburgh – Self Storage | $0.0 | 0.0% | 0.0% |
| Portland-Vancouver-Beaverton, OR-WA MSA | $501.7 | 7.4% | 0.0% |
| Portland – Hotel | $470.8 | 54.2% | -0.3% |
| Portland – Industrial | $0.0 | 0.0% | 0.0% |
| Portland – Multifamily | $10.2 | 0.2% | 0.0% |
| Portland – Office | $20.8 | 5.3% | -0.8% |
| Portland – Other | $0.0 | 0.0% | 0.0% |
| Portland – Retail | $0.0 | 0.0% | 0.0% |
| Portland – Self Storage | $0.0 | 0.0% | 0.0% |
| Raleigh-Cary, NC MSA | $09.5 | 0.3% | -0.1% |
| Raleigh – Hotel | $09.5 | 3.0% | -0.7% |
| Raleigh – Industrial | $0.0 | 0.0% | 0.0% |
| Raleigh – Multifamily | $0.0 | 0.0% | 0.0% |
| Raleigh – Office | $0.0 | 0.0% | 0.0% |
| Raleigh – Other | $0.0 | 0.0% | 0.0% |
| Raleigh – Retail | $0.0 | 0.0% | 0.0% |
| Raleigh – Self Storage | $0.0 | 0.0% | 0.0% |
| Richmond, VA MSA | $82.3 | 2.4% | -1.2% |
| Richmond – Hotel | $0.0 | 0.0% | -14.1% |
| Richmond – Industrial | $0.0 | 0.0% | 0.0% |
| Richmond – Multifamily | $0.0 | 0.0% | 0.0% |
| Richmond – Office | $0.0 | 0.0% | 0.0% |
| Richmond – Other | $0.0 | 0.0% | 0.0% |
| Richmond – Retail | $82.3 | 14.6% | -0.8% |
| Richmond – Self Storage | $0.0 | 0.0% | 0.0% |
| Riverside-San Bernardino-Ontario, CA MSA | $308.1 | 3.2% | -0.7% |
| Riverside – Hotel | $84.2 | 26.9% | 0.9% |
| Riverside – Industrial | $0.0 | 0.0% | 0.0% |
| Riverside – Multifamily | $02.4 | 0.1% | -0.1% |
| Riverside – Office | $0.0 | 0.0% | 0.0% |
| Riverside – Other | $0.0 | 0.0% | 0.0% |
| Riverside – Retail | $221.5 | 10.6% | -3.0% |
| Riverside – Self Storage | $0.0 | 0.0% | 0.0% |
| Sacramento-Arden-Arcade-Roseville, CA MSA | $25.5 | 0.4% | -0.1% |
| Sacramento – Hotel | $05.8 | 1.6% | 0.0% |
| Sacramento – Industrial | $0.0 | 0.0% | 0.0% |
| Sacramento – Multifamily | $0.0 | 0.0% | 0.0% |
| Sacramento – Office | $06.1 | 0.8% | -1.2% |
| Sacramento – Other | $0.0 | 0.0% | 0.0% |
| Sacramento – Retail | $13.6 | 1.7% | 0.0% |
| Sacramento – Self Storage | $0.0 | 0.0% | 0.0% |
| Salt Lake City, UT MSA | $47.0 | 1.2% | 0.0% |
| Salt Lake City – Hotel | $47.0 | 16.3% | -0.3% |
| Salt Lake City – Industrial | $0.0 | 0.0% | 0.0% |
| Salt Lake City – Multifamily | $0.0 | 0.0% | 0.0% |
| Salt Lake City – Office | $0.0 | 0.0% | 0.0% |
| Salt Lake City – Other | $0.0 | 0.0% | 0.0% |
| Salt Lake City – Retail | $0.0 | 0.0% | 0.0% |
| Salt Lake City – Self Storage | $0.0 | 0.0% | 0.0% |
| San Antonio, TX MSA | $140.9 | 2.2% | 0.0% |
| San Antonio – Hotel | $08.4 | 2.5% | 0.0% |
| San Antonio – Industrial | $0.0 | 0.0% | 0.0% |
| San Antonio – Multifamily | $0.0 | 0.0% | 0.0% |
| San Antonio – Office | $0.0 | 0.0% | 0.0% |
| San Antonio – Other | $0.0 | 0.0% | 0.0% |
| San Antonio – Retail | $131.0 | 14.3% | -0.7% |
| San Antonio – Self Storage | $01.5 | 1.0% | -0.1% |
| San Diego-Carlsbad-San Marcos, CA MSA | $214.5 | 1.9% | -0.5% |
| San Diego – Hotel | $79.2 | 4.0% | -2.3% |
| San Diego – Industrial | $0.0 | 0.0% | 0.0% |
| San Diego – Multifamily | $0.0 | 0.0% | 0.0% |
| San Diego – Office | $0.0 | 0.0% | 0.0% |
| San Diego – Other | $20.6 | 2.9% | -0.4% |
| San Diego – Retail | $114.8 | 9.3% | -0.4% |
| San Diego – Self Storage | $0.0 | 0.0% | 0.0% |
| San Francisco-Oakland-Fremont, CA MSA | $325.5 | 1.3% | 0.1% |
| San Francisco – Hotel | $171.7 | 7.3% | -1.0% |
| San Francisco – Industrial | $0.0 | 0.0% | 0.0% |
| San Francisco – Multifamily | $20.0 | 0.3% | 0.0% |
| San Francisco – Office | $55.6 | 0.5% | 0.4% |
| San Francisco – Other | $30.6 | 1.7% | -0.1% |
| San Francisco – Retail | $47.7 | 4.1% | 0.4% |
| San Francisco – Self Storage | $0.0 | 0.0% | 0.0% |
| San Jose-Sunnyvale-Santa Clara, CA MSA | $104.1 | 0.7% | 0.0% |
| San Jose – Hotel | $89.4 | 4.3% | -0.2% |
| San Jose – Industrial | $0.0 | 0.0% | 0.0% |
| San Jose – Multifamily | $0.0 | 0.0% | 0.0% |
| San Jose – Office | $14.7 | 0.2% | 0.0% |
| San Jose – Other | $0.0 | 0.0% | 0.0% |
| San Jose – Retail | $0.0 | 0.0% | 0.0% |
| San Jose – Self Storage | $0.0 | 0.0% | 0.0% |
| Seattle-Tacoma-Bellevue, WA MSA | $109.2 | 0.6% | 0.0% |
| Seattle – Hotel | $109.2 | 8.3% | 0.6% |
| Seattle – Industrial | $0.0 | 0.0% | 0.0% |
| Seattle – Multifamily | $0.0 | 0.0% | 0.0% |
| Seattle – Office | $0.0 | 0.0% | 0.0% |
| Seattle – Other | $0.0 | 0.0% | 0.0% |
| Seattle – Retail | $0.0 | 0.0% | 0.0% |
| Seattle – Self Storage | $0.0 | 0.0% | 0.0% |
| St. Louis, MO-IL MSA | $414.6 | 9.8% | 0.4% |
| St. Louis – Hotel | $58.2 | 20.7% | 6.1% |
| St. Louis – Industrial | $0.0 | 0.0% | 0.0% |
| St. Louis – Multifamily | $24.3 | 1.5% | 0.1% |
| St. Louis – Office | $107.1 | 19.2% | 0.0% |
| St. Louis – Other | $26.4 | 4.8% | 0.0% |
| St. Louis – Retail | $198.6 | 20.0% | -0.4% |
| St. Louis – Self Storage | $0.0 | 0.0% | 0.0% |
| Tampa-St. Petersburg-Clearwater, FL | $300.1 | 3.3% | 0.0% |
| Tampa – Hotel | $30.0 | 2.6% | -0.1% |
| Tampa – Industrial | $0.0 | 0.0% | 0.0% |
| Tampa – Multifamily | $02.6 | 0.0% | 0.0% |
| Tampa – Office | $23.8 | 4.0% | -0.2% |
| Tampa – Other | $0.0 | 0.0% | 0.0% |
| Tampa – Retail | $243.8 | 26.9% | 0.6% |
| Tampa – Self Storage | $0.0 | 0.0% | 0.0% |
| Tucson, AZ MSA | $166.8 | 5.4% | -0.2% |
| Tucson – Hotel | $04.7 | 1.9% | 1.4% |
| Tucson – Industrial | $0.0 | 0.0% | 0.0% |
| Tucson – Multifamily | $0.0 | 0.0% | 0.0% |
| Tucson – Office | $0.0 | 0.0% | 0.0% |
| Tucson – Other | $0.0 | 0.0% | 0.0% |
| Tucson – Retail | $162.1 | 20.2% | -3.7% |
| Tucson – Self Storage | $0.0 | 0.0% | 0.0% |
| Virginia Beach-Norfolk-Newport News, VA-NC MSA | $211.7 | 4.7% | -0.2% |
| Virginia Beach – Hotel | $12.1 | 2.7% | 0.6% |
| Virginia Beach – Industrial | $21.2 | 6.7% | -6.7% |
| Virginia Beach – Multifamily | $0.0 | 0.0% | 0.0% |
| Virginia Beach – Office | $0.0 | 0.0% | 0.0% |
| Virginia Beach – Other | $0.0 | 0.0% | 0.0% |
| Virginia Beach – Retail | $178.4 | 20.7% | -0.2% |
| Virginia Beach – Self Storage | $0.0 | 0.0% | 0.0% |
| Washington-Arlington-Alexandria, DC-VA-MD-WV MSA | $611.3 | 2.2% | -0.8% |
| Washington, DC – Hotel | $44.2 | 4.8% | -0.3% |
| Washington, DC – Industrial | $11.2 | 2.0% | 0.0% |
| Washington, DC – Multifamily | $01.3 | 0.0% | 0.0% |
| Washington, DC – Office | $357.0 | 5.3% | -0.7% |
| Washington, DC – Other | $44.7 | 2.8% | -10.7% |
| Washington, DC – Retail | $153.0 | 5.5% | -0.1% |
| Washington, DC – Self Storage | $0.0 | 0.0% | 0.0% |
| Grand Total | $25,921.4 | 3.9% | -0.2% |
About CRED iQ
CRED iQ is a commercial real estate data, analytics, and valuation platform providing actionable intelligence to CRE and capital markets investors. Subscribers to CRED iQ use the platform to identify valuable leads for leasing, lending, refinancing, distressed debt, and acquisition opportunities. Our data platform is powered by over $2.0 trillion of CMBS, CRE CLO, SBLL, Ginnie Mae, FHA/HUD, and Freddie Mac loan and property data.
