CRED iQ aggregated all of the payment statuses reported by each loan in January as well as its special servicing status to arrive at the Overall Distress Rate.
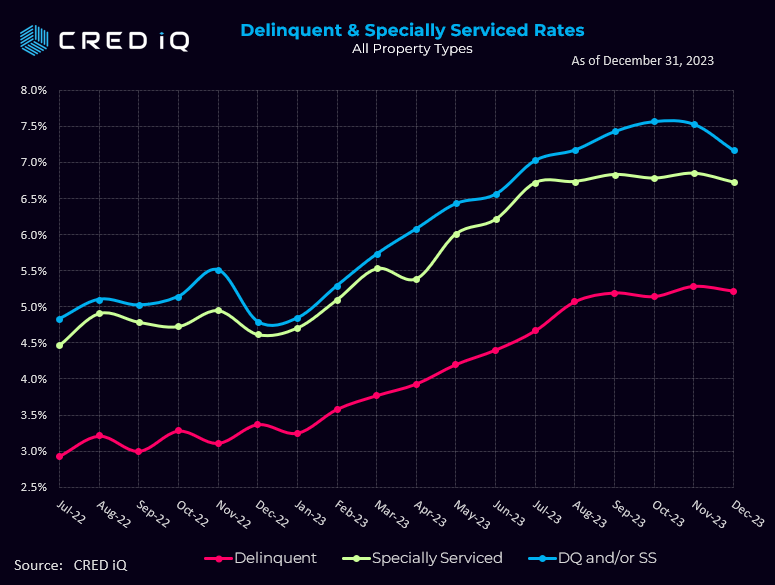
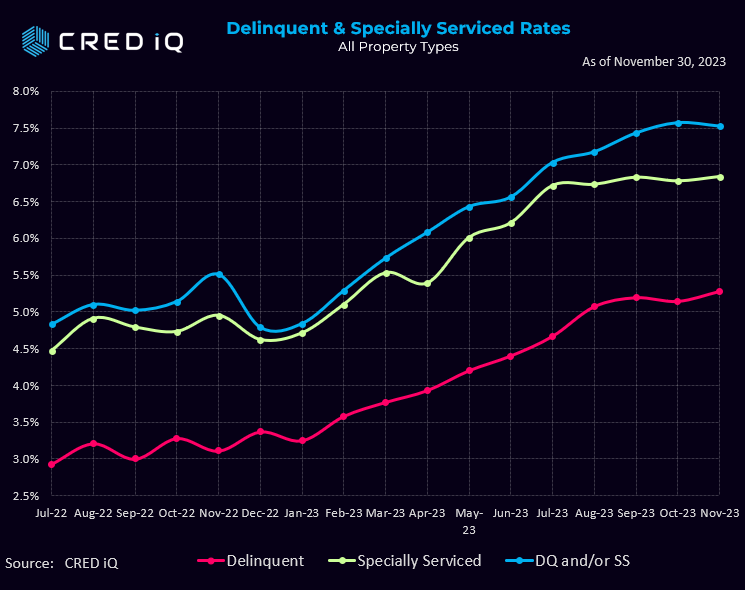
CRED iQ’s overall distress rate for CMBS increased by 22 basis points in January to 7.39% from 7.17% – snapping a two-month streak of declines.
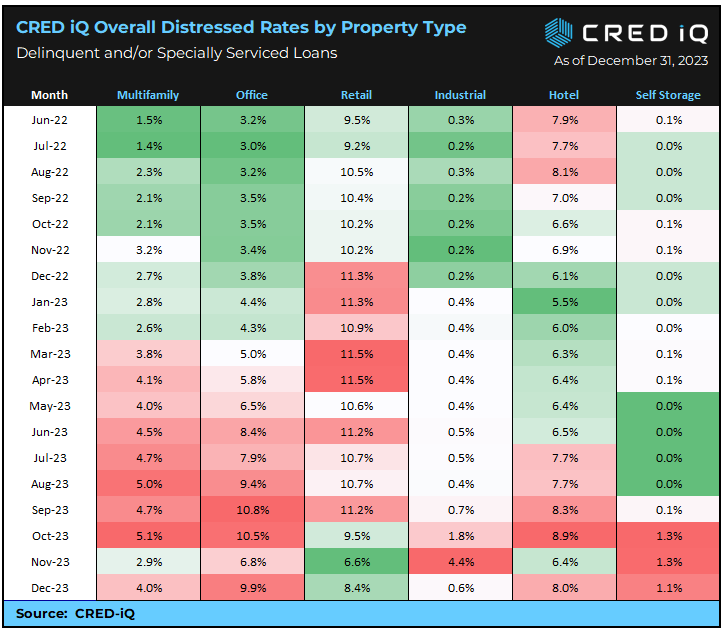
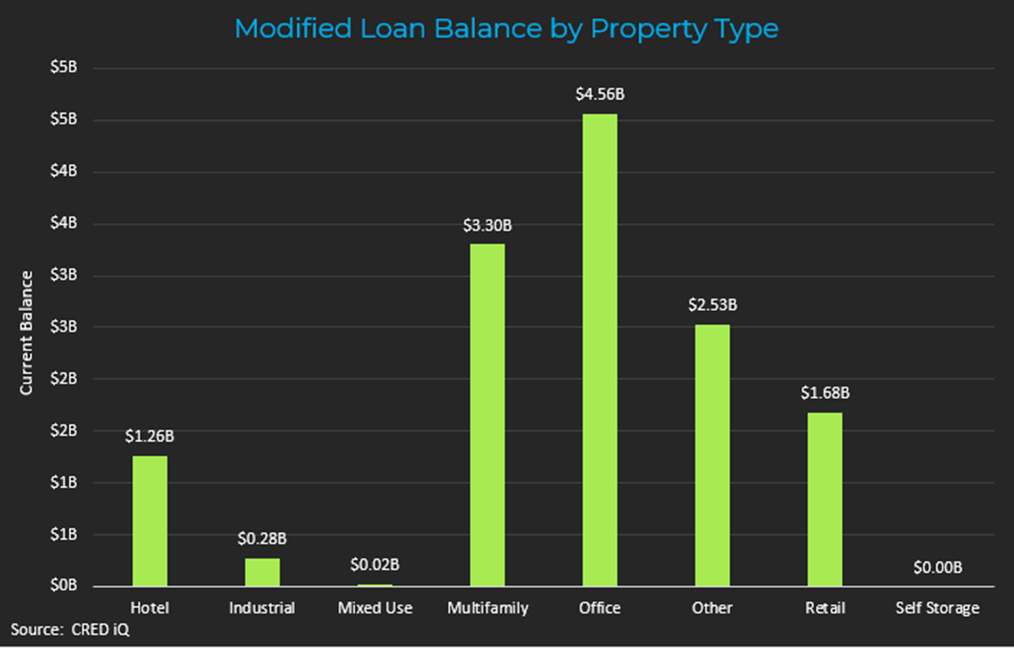
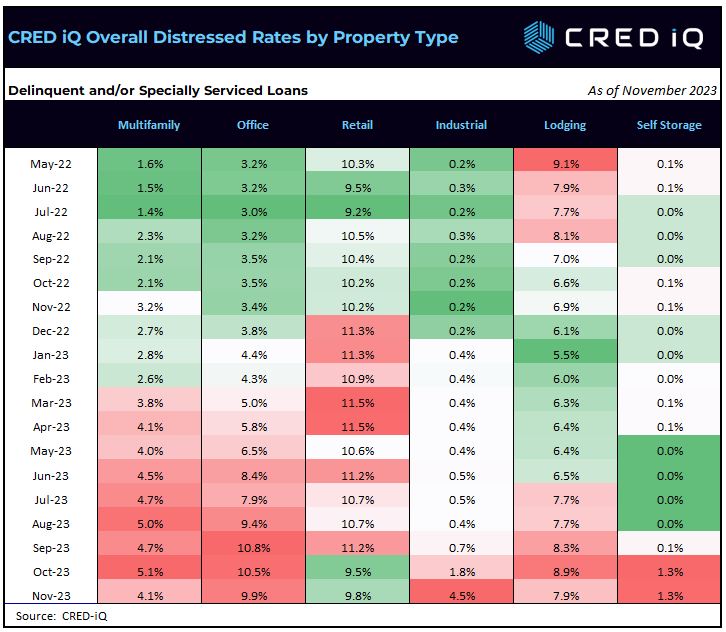
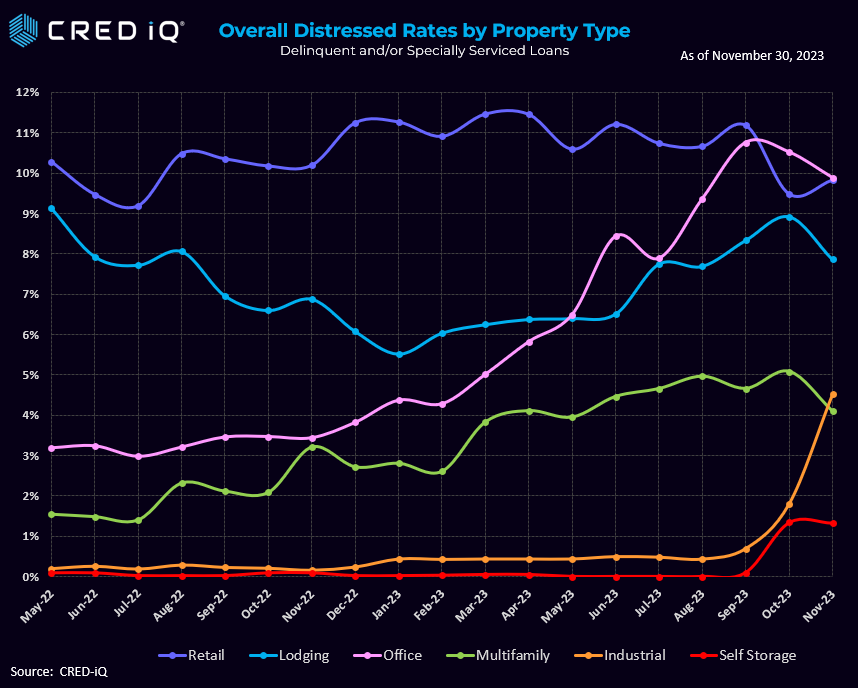
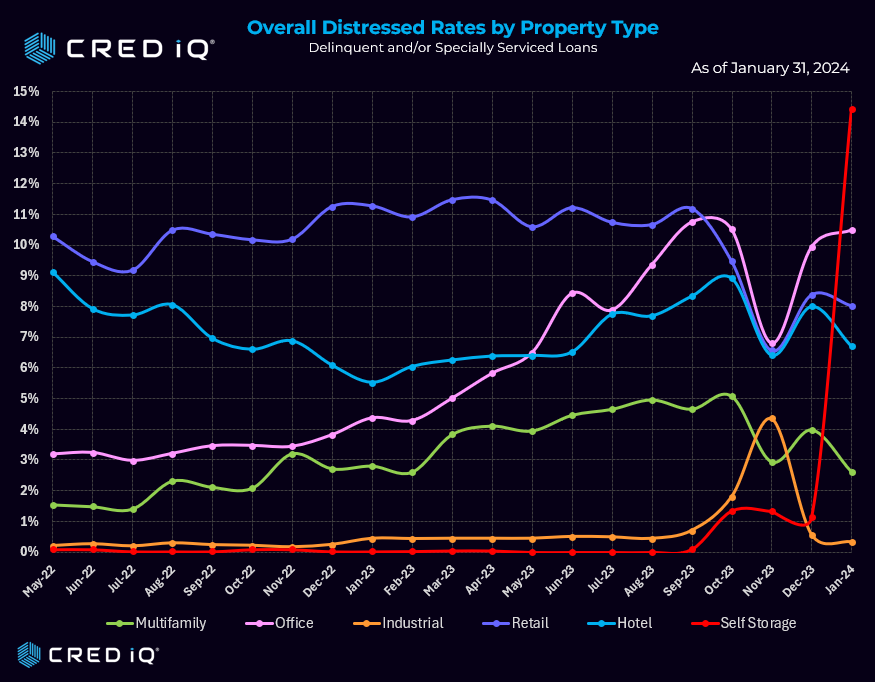
The office segment added 55 basis points in January following a 315-point increase in December. Office has now crested over 10% in overall distress for the first time since October.
Meanwhile, multifamily, retail, and hotel sectors all saw decreases in the January print.
CRED iQ’soverall distress rate aggregates the two indicators of distress – delinquency rate and special servicing rate – into an overall distressed rate. This includes any loan with a payment status of 30+ days or worse, any loan actively with the special servicer, and includes non-performing and performing loans that have failed to pay off at maturity.
The CRED iQ delinquency rate rose in parallel with the overall distress rate –adding 23 basis points, while the specially serviced rate shaved off 5 basis points.
The self-storage segment, which has spent most of the past 12 months under 1.0% in overall distress, saw its overall distress level skyrocket in January. Most of this is attributable a $2.1 billion loan backed by a 112,084 SF portfolio consisting of 16 self-storage properties throughout New York City. The loan passed its January 9, 2024 maturity date, but continues to perform. The loan was added to the servicer’s watchlist in December due to upcoming maturity. Servicer commentary indicates the borrower’s request for a maturity extension is being reviewed.
Office remains the segment with consistently highest percentage of overall distress at 10.50% (excluding this month’s self-storage spike, which we expect to come down to its normal trend of below 1.0%).
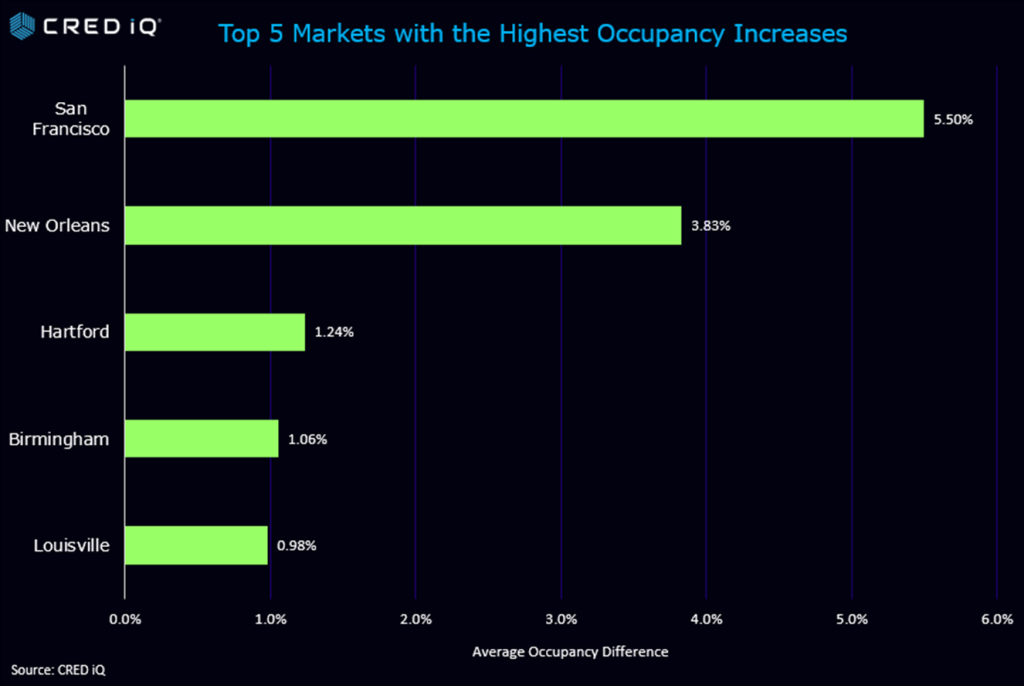
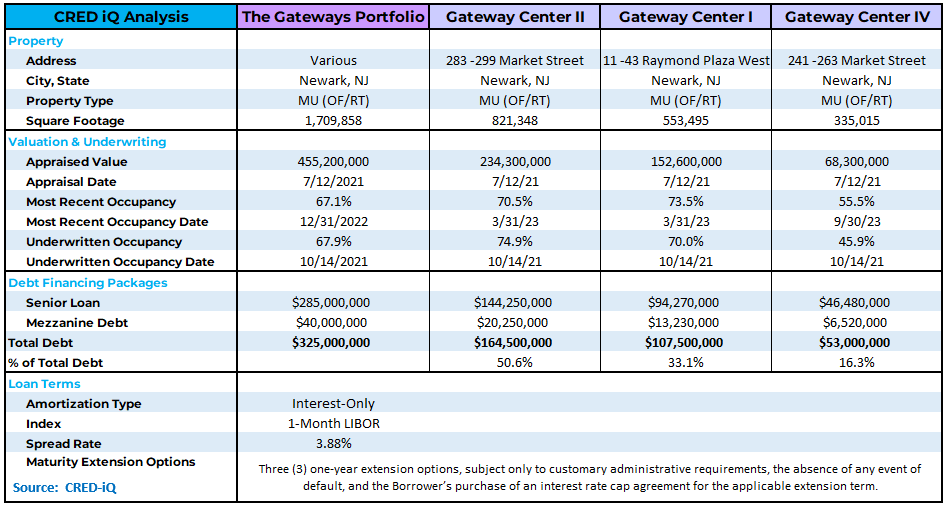
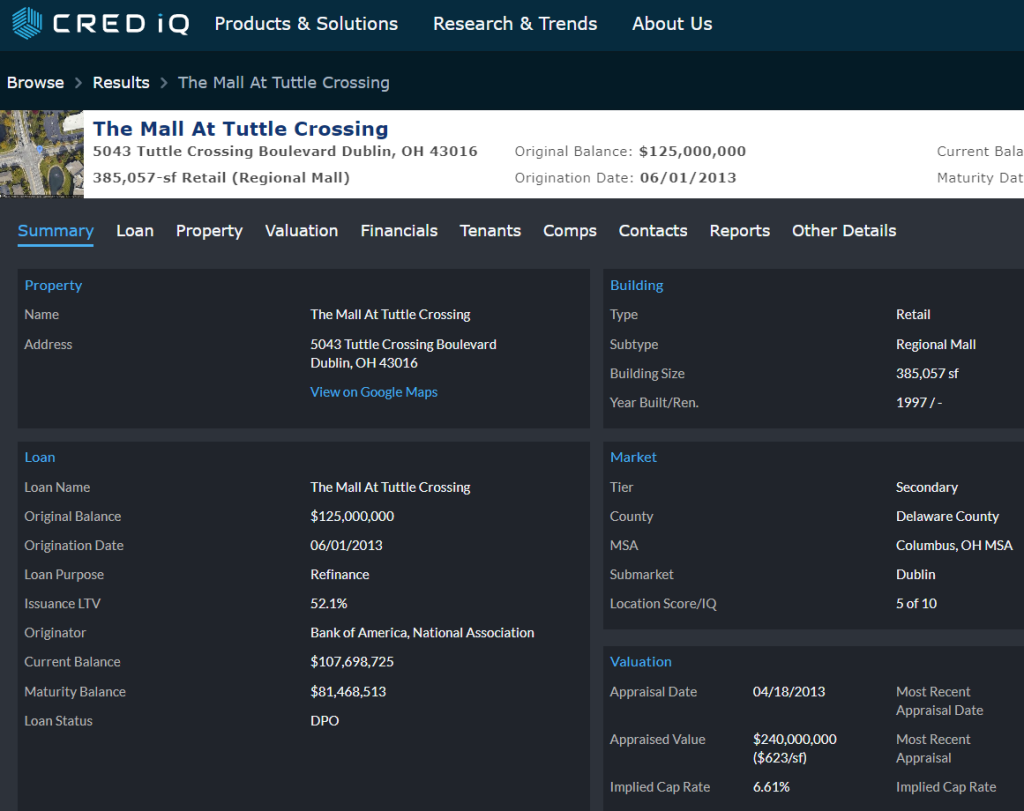
Additionally, One Market Plaza, a 1.6 million SF office tower in San Francisco, is backed by a $975.0 million loan that transferred to the special servicer in January due to the February 6, 2024 maturity. Servicer commentary indicates the borrower is discussing a potential extension. The property was 95.8% occupied as of September 2023 with Google (21.6% of GLA) being the largest tenant.
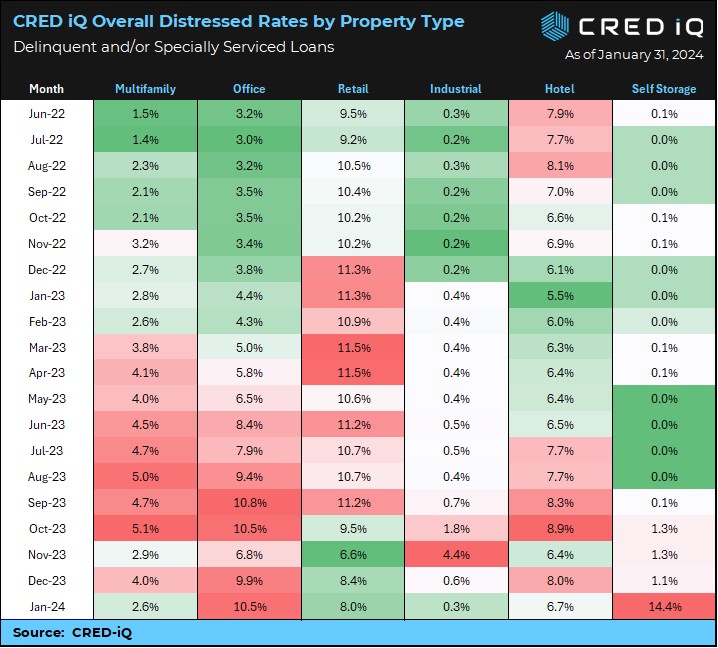
The industrial segment, once again, saw the greatest decrease in overall delinquency—dropping 24 basis points in January following a whopping 3.8% reduction in December. We have discussed the anomalies in the Industrial prints in October and November largely attributable to the the $2.2 billion industrial portfolio (BX Trust 2021-ACNT) that failed to pay off on its initial November 9, 2023 maturity date is now listed as current by its servicer, Key Bank. Industrial now settles back to familiar territory of 0.32% overall distress.
About CRED iQ
CRED iQ is a commercial real estate data, analytics, and valuation platform providing actionable intelligence to CRE and capital markets investors. Subscribers use the platform to identify valuable leads for leasing, lending, refinancing, distressed debt, and acquisition opportunities.
The platform also offers a highly efficient valuation engine which can be leveraged across all property types and geographies. Our data platform is powered by over $2.0 trillion in transactions and data covering CRE, CMBS, CRE CLO, Single Asset Single Borrower (SASB), and all of GSE / Agency.