CRED iQ’s research team has fielded multiple requests to explore the CRE CLO ecosystem from a wide array of perspectives. We are most grateful for these suggestions. This week we decided to extend the horizon a bit as the marketplace approaches a milestone in the watchlist category. What can we draw from the latest data and trending?
We sub-divided the CRE CLO from two perspectives: 1) Loans that have been added to the servicer watchlist. 2) The triggers that caused the watchlist designation.
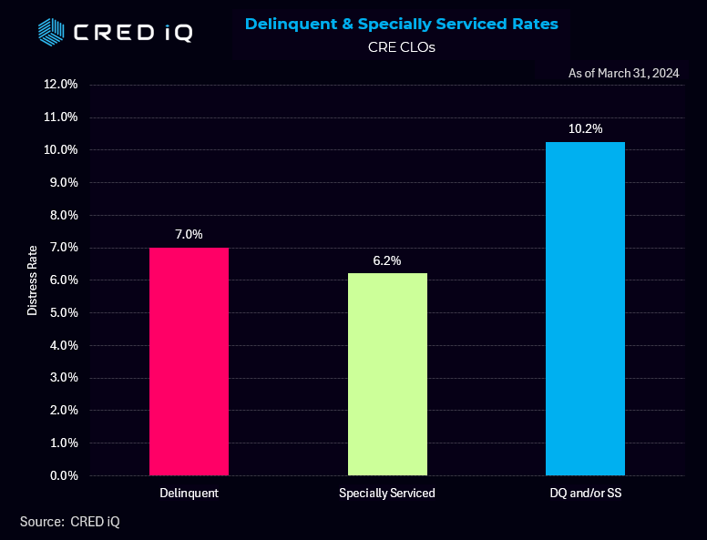
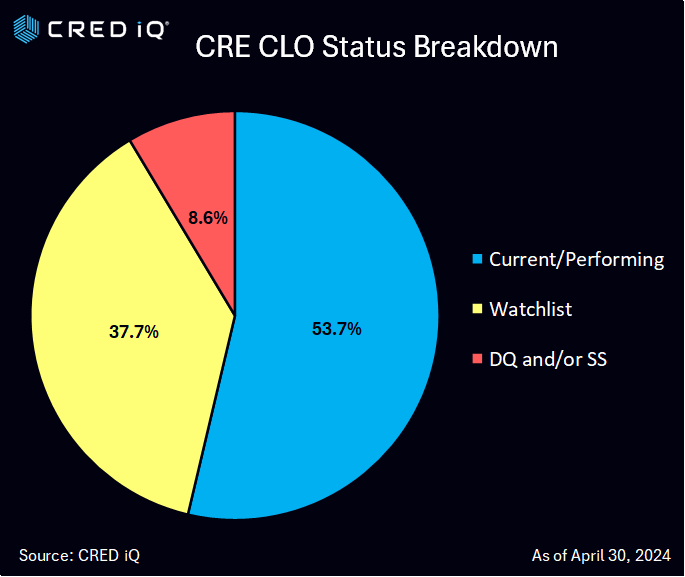
CRED iQ’s latest loan-level analysis as of April 30, 2024 indicated that 38.6% of CRE CLO loans are currently on the servicer’s watchlist. This is in addition to CRED iQ’s overall distress rate of 8.6% for CRE CLO loans that are either delinquent or with the special servicer. Combining these two figures (37.7% watchlist and 8.6% delinquent/specially serviced), CRED iQ calculates 46.3% of these loans are in some level of trouble.
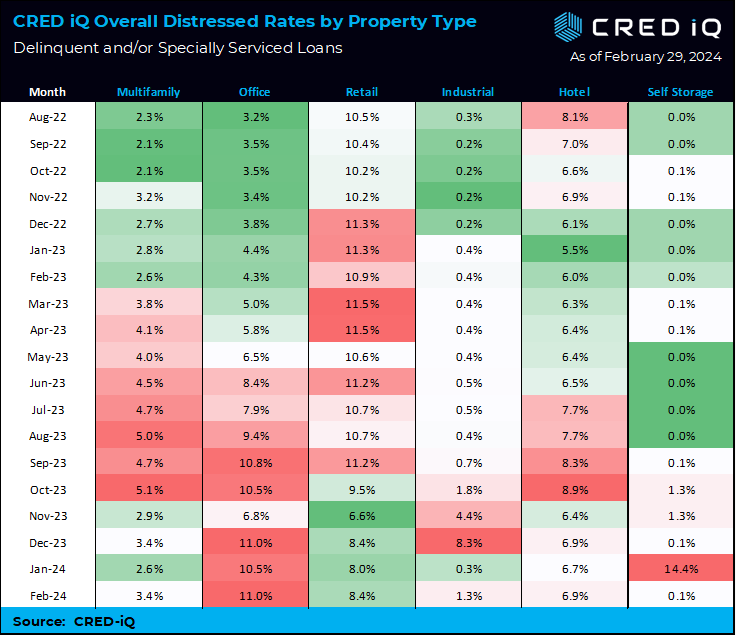
An important early bellwether, the watchlist percentage continues to climb to historic levels. As 8.6% of the CRE CLO loans are currently in special servicing and/or delinquent – revealing a wide gap which could imply that the special serving & delinquency percentages is likely to grow.
Some of the largest issuers of CRE CLO debt over the past five years include MF1, Arbor, LoanCore, Benefit Street Partners, Bridge Investment Group, FS Rialto, and TPG. CRED iQ consolidated all of the loan-level performance data for every outstanding CRE CLO loan to measure the underlying risks associated with these transitional assets. Many of these loans were originated in 2021 at times where cap rates were low, valuations high, low interest rates, and are starting to run into maturity issues given the spike in rates.
Looking across the causes that drive the distress rating, Floating DSR Triggers dominate the reason for the distressed classification. Pending Maturity or ARD represented the largest single category reported.
Outstanding CRE CLO loans amount to approximately $75 billion in loans as of April 30, 2024. The vast majority of these CRE CLO loans are structured with floating rate loans with 3-year loan terms equipped with loan extension options if certain financial hurdles are met.
One such example is the Desert Gardens, a 307-unit multifamily property located in Glendale, AZ within the market of Phoenix. The garden-style property is backed by a $40.0 million ($130,354/unit) loan that was added to the servicer’s watchlist this month due to decreased occupancy. The asset was 84% occupied and performing with a below break-even DSCR of 0.21 as of year-end 2023. The garden-style property was built in 1984 and is undergoing renovations. The prospectus reveals renovation plans included all 307 units, common space areas, and the exterior.
Servicer commentary indicates the borrower is interested in extending the June 2024 maturity date of the loan. At the time of origination, the loan had two, one-year extension options implying a fully extended maturity date of June 2026. The loan was originated with a 3.500% interest rate on a $48.0 million ($156,352/unit) appraisal in 2021. The current interest rate has increased to 8.82% from 3.55% at origination.
About CRED iQ
CRED iQ is a commercial real estate data, analytics, and valuation platform providing actionable intelligence to CRE and capital markets investors. Subscribers use the platform to identify valuable leads for leasing, lending, refinancing, distressed debt, and acquisition opportunities.
The platform also offers a highly efficient valuation engine which can be leveraged across all property types and geographies. Our data platform is powered by over $2.0 trillion in transactions and data covering CRE, CMBS, CRE CLO, Single Asset Single Borrower (SASB), and all of GSE / Agency.