CRED iQ analyzed insurance premiums from 2010 to Q1 2023. Our research aimed to uncover the trends and drivers behind the rise in insurance costs on CRE properties over recent years. Notably, Commercial Property Insurance Premiums experienced a significant increase of 20.4% in Q1 2023.
The increasing occurrence and severity of natural disasters continue to be a major worry in the commercial property insurance sector. These catastrophic events frequently lead to substantial property damage and significant financial hardships for policyholders. In just the initial quarter of 2023, the global economy suffered $77 billion in losses due to natural disasters, with insurers covering a third of that cost, amounting to $22 billion.
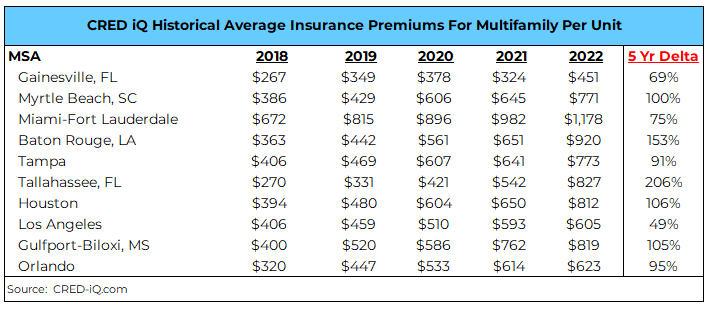
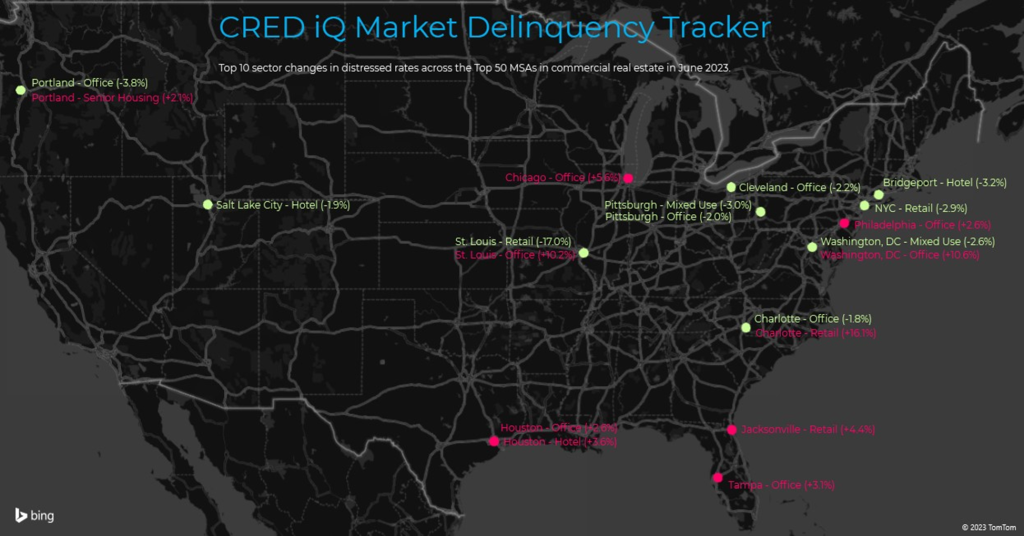
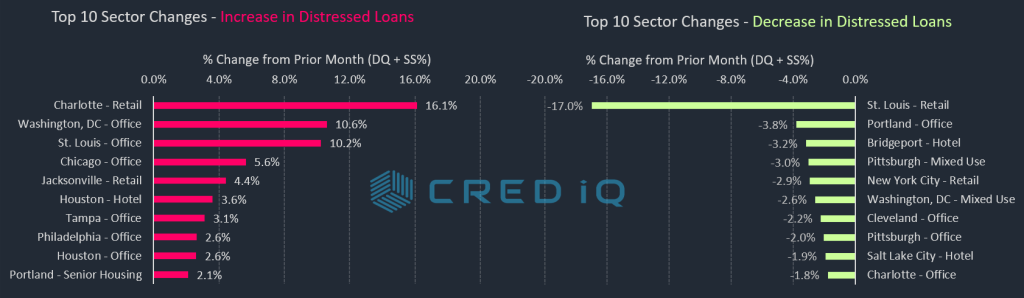
CRED iQ’s research team measured the magnitude of these insurance premium hikes and pinpointed the Top 10 Metropolitan Statistical Areas (MSAs) that have witnessed the most substantial increases in premiums for properties on a per unit basis.
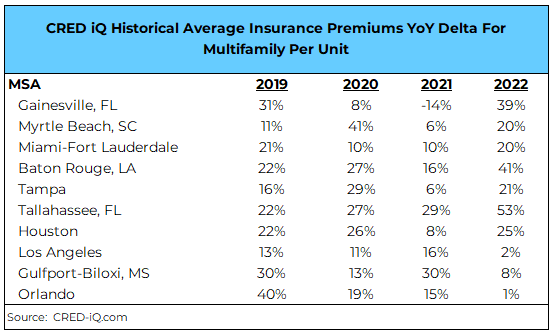
CRED iQ has also calculated the historical insurance premium year over year delta again for multifamily on a per unit basis.
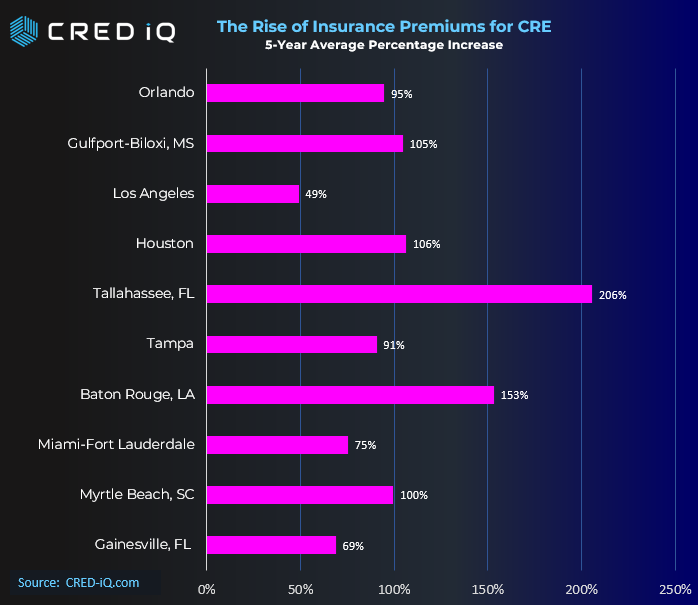
Florida stands out as a state where insurance premiums have surged significantly. The heightened exposure in the Commercial Real Estate (CRE) sector is creating financial difficulties for properties facing upcoming insurance policy renewals and seeking new property financing. This is evident when comparing the 5-year percentage change from 2018 to 2022.
CRED iQ has identified a multifamily property in Tampa, Florida, known as The Grand Reserve at Tampa Palms. This property, which comprises 390 units and was constructed in 1999, serves as a prime example of how extreme weather events have led to financial distress over time.
In 2017, according to CRED iQ’s comprehensive financial database, this property had an Insurance Premium of approximately $183,000. However, when we examine the fiscal year 2022, the same property incurred a significant increase, with an insurance cost of $521,000. This represents a staggering 185% rise, translating to an increase from $469 per unit to $1,336 per unit.
Insurance rates for commercial real estate can be influenced by various factors, including:
1. Market Conditions: Changes in overall market dynamics, like shifts in demand for insurance coverage, can influence insurance rates. High demand due to increased risk factors or market trends can lead to rate hikes.
2. Property Location and Risk Assessment: The property’s location plays a vital role in determining insurance rates. Areas prone to natural disasters or higher crime rates typically result in higher premiums.
3. Property Type and Use: The type and intended use of the property affect rates. Properties with more occupants, hazardous materials, or elevated risk features can lead to higher insurance costs.
4. Claims History: Past insurance claims and losses impact future rates. Frequent claims or significant damages in the property’s history can lead to increased premiums.
5. Construction and Building Materials: The quality of construction and materials used affects rates. Older properties or those with vulnerable materials might have higher premiums.
6. Legal and Regulatory Factors: Changes in regulations or building codes can impact rates. Local, state, or federal shifts in safety standards or insurance requirements can influence costs.
7. Economic Factors: Economic conditions, such as inflation and interest rates, can impact insurance costs. Inflation can raise rebuilding expenses, leading to higher premiums.
8. Trends in Litigation and Liability: An increase in litigation or liability claims in commercial real estate can prompt insurers to raise rates to cover potential payouts.
9. Reinsurance Costs: Insurers use reinsurance to manage large losses. If reinsurance costs rise due to global events, insurers may pass those costs to policyholders.
10. Global Events and Catastrophes: Large-scale events like natural disasters or pandemics can heighten risk and impact insurance rates by affecting the industry’s financial stability.
These expenses are anticipated to continue and could even escalate throughout the remainder of 2023. This is due to the onset of the hurricane season and the ongoing spread of wildfires in the Western U.S. The National Oceanic and Atmospheric Administration (NOAA) has foreseen the possibility of up to 17 named storms forming during the 2023 Atlantic hurricane season, which spans from June 1 to November 30. Among these storms, nine could potentially transform into hurricanes with winds exceeding 74 mph, and four of them might attain significant strength with winds surpassing 111 mph.
According to the latest information from the National Interagency Fire Center (NIFC), there have been approximately 20,000 wildfires that have already consumed over 621,000 acres along the West Coast. While this number is lower than the 10-year average, it serves as an indication of another demanding wildfire season in the upcoming months. Climate experts predict that the ongoing patterns of natural disasters will persist, further intensifying the damages associated with them for the foreseeable future.
Consequently, several reinsurers have acted to restrict their willingness to cover these risks or have even withdrawn their coverage entirely, while rates continue to rise. According to data from the industry, reinsurance treaty renewals on January 1 brought some of the most challenging market conditions in many years. The capacity for additional coverage layers reduced by more than 50%, and policyholders encountered rate hikes ranging from 40% to 100%, depending on their vulnerability to catastrophic events. A similar trend was observed during renewals on June 1, with capacity tightening further and rate increases ranging from 25% to 40%. These developments highlight the ongoing cautious approach prevalent within the reinsurance sector.
About CRED iQ
CRED iQ is a commercial real estate data, analytics, and valuation platform providing actionable intelligence to CRE and capital markets investors. Subscribers use the platform to identify valuable leads for leasing, lending, refinancing, distressed debt, and acquisition opportunities.The platform also offers a highly efficient valuation engine which can be leveraged across all property types and geographies. Our data platform is powered by over $2.0 trillion in transactions and data covering CRE, CMBS, CRE CLO, Single Asset Single Borrower (SASB), and all of GSE / Agency.